June 18, 2025 a 04:28 am


USDCAD: Trend and Support & Resistance Analysis
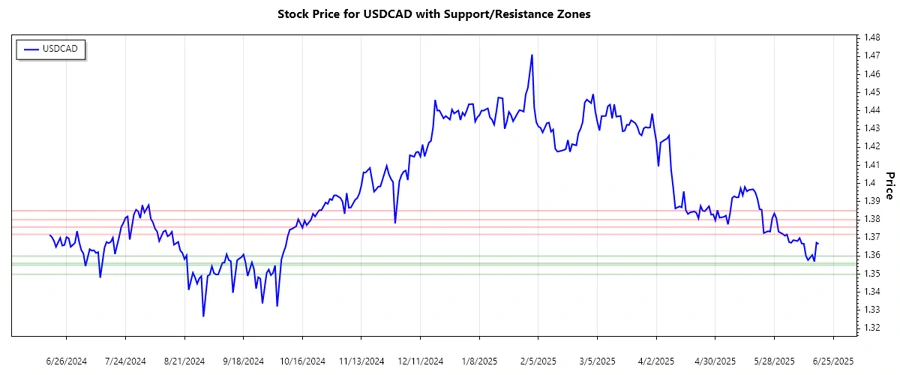
The analysis of the USDCAD currency pair over the last few months shows a predominantly downward trend. The Exchange Rate showed recovery signs but remains within bearish control. Key support and resistance zones have been identified, providing insight into potential market reversals or continuations. It is an opportunity to cautiously observe potential swing points to optimize the trading strategy.
Trend Analysis
Analyzing the closing prices of USDCAD, it can be observed that the overall trend is downward. Calculating the Exponential Moving Averages for periods of 20 and 50 days respectively, we find that EMA20 remains consistently below EMA50 indicating a bearish trend. Recent market data over the past week may show fluctuating signs, but no significant upside momentum has been confirmed.
| Date | Closing Price | Trend |
|---|---|---|
| 2025-06-18 | 1.36662 | ▼ Bearish |
| 2025-06-17 | 1.36743 | ▼ Bearish |
| 2025-06-16 | 1.35693 | ▼ Bearish |
| 2025-06-15 | 1.36061 | ▼ Bearish |
| 2025-06-13 | 1.35777 | ▼ Bearish |
| 2025-06-12 | 1.36014 | ▼ Bearish |
| 2025-06-11 | 1.36681 | ▼ Bearish |
In conclusion, the continuous decline in the EMA values reaffirms a prevailing bearish mood in the USDCAD market. Traders should exercise caution and possibly anticipate continued pressure on the currency pair.
Support and Resistance
In identifying support and resistance zones, recent price action suggests significant levels. These price areas could be pivotal in determining future price movements as potential reversal or continuation points.
| Zone Type | From | To |
|---|---|---|
| Support Zone 1 | 1.3560 | 1.3600 |
| Support Zone 2 | 1.3500 | 1.3550 |
| Resistance Zone 1 | 1.3720 | 1.3760 |
| Resistance Zone 2 | 1.3800 | 1.3850 |
Current trading prices are near the first support zone. Should prices hold and bounce within this range, upward potential may be realized. However, if breached, further downside is likely.
These zones act as strategic points where traders might look for reversals or accelerations in price action, providing valuable market insight.
Conclusion
The continued bearish trend in USDCAD indicates sustained selling pressure with limited recovery attempts. Presently, the market is testing crucial support levels that may either hold or accelerate further declines. Traders must closely monitor price reactions at these levels to capitalize on potential reversals or validation of continuing trends. The strategic trading ahead demands diligence and observing movements within identified zones. The existing downtrend poses risks of further downside; however, it also carries the possibility of significant rebound opportunities if support levels are resilient.
Smart Data Insight
Master the Perfect Entry & Exit for this Stock
Don't leave your profits to chance. Historically, this stock follows specific seasonal patterns that institutional traders use to maximize returns.
- ✅ Identify the "Golden Buying Window"
- ✅ Avoid high-risk correction cycles
- ✅ Backtested data from the last 20+ years