
November 14, 2026 a 05:08 am

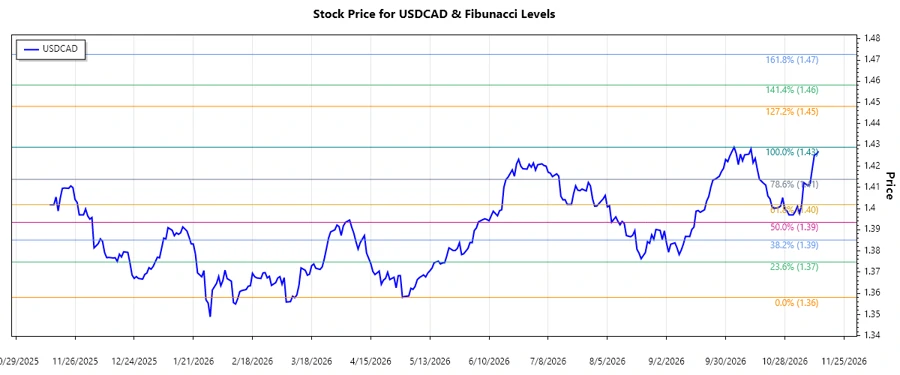
USDCAD: Fibonacci Analysis
The USDCAD currency pair has exhibited a notable uptrend over the recent months, with the exchange rate climbing significantly from early periods to its latest values. This trend reflects a strengthening of the US dollar against the Canadian dollar, driven by various economic indicators and market sentiment. The pair's volatility and large movements present both opportunities and risks for traders as they navigate these fluctuations.
Fibonacci Analysis
The latest data indicate a dominant upward trend in USDCAD, reaching a high of 1.42889 on October 4, 2026, from a low of 1.35808 on April 30, 2026. Based on this upward trajectory, the following Fibonacci retracement levels are calculated:
| Level | Price |
|---|---|
| 0.236 | 1.37422 |
| 0.382 | 1.39223 |
| 0.5 | 1.40348 |
| 0.618 | 1.41472 |
| 0.786 | 1.42702 |
Currently, the USDCAD is around 1.42699, placing it within the 0.786 retracement zone. This level might serve as a potential resistance point before further movements are observed. Traders should watch for rejection or breakthrough signals to estimate future volatility and position accordingly.
Conclusion
The USDCAD has sustained its upward momentum, showcasing strong support for the US dollar relative to the Canadian dollar. The immediate retracement zone at 0.786 indicates a critical juncture where market direction could shift swiftly. While the prospects for further ascent exist, driven by economic policies and market optimism, traders should exercise caution, hedging potential downturns due to unforeseen market shifts. Continuous monitoring of international economic factors and geopolitical events will be pivotal in forecasting the longevity and health of this uptrend.
Smart Data Insight
Master the Perfect Entry & Exit for this Stock
Don't leave your profits to chance. Historically, this stock follows specific seasonal patterns that institutional traders use to maximize returns.
- ✅ Identify the "Golden Buying Window"
- ✅ Avoid high-risk correction cycles
- ✅ Backtested data from the last 20+ years