February 02, 2026 a 05:08 am# USDCAD: Fibonacci Analysis
 ## Fibonacci Analysis
The dominant trend identified for the USDCAD is a downtrend, spanning from 2025-11-04 to 2026-02-02. The high was recorded at 1.41067 on 2025-11-04, and the low at 1.35548 on 2026-01-28.
### Fibonacci Levels
- **High Price**: 1.41067 (Date: 2025-11-04)
- **Low Price**: 1.35548 (Date: 2026-01-28)
**Fibonacci Retracement Levels**
## Fibonacci Analysis
The dominant trend identified for the USDCAD is a downtrend, spanning from 2025-11-04 to 2026-02-02. The high was recorded at 1.41067 on 2025-11-04, and the low at 1.35548 on 2026-01-28.
### Fibonacci Levels
- **High Price**: 1.41067 (Date: 2025-11-04)
- **Low Price**: 1.35548 (Date: 2026-01-28)
**Fibonacci Retracement Levels**
Currently, USDCAD is trading around 1.36615, placing it close to the 0.236 retracement level. This zone is a potential area of resistance, and a failed breakthrough might signal a continuation of the downtrend.
Understanding these retracement levels is crucial, as they may indicate potential reversal points. If the current price holds below these levels, the prevailing bearish trend could persist.

The USDCAD has recently been in a downward trend, reflecting a weakening in the USD against the CAD. The series of lower highs and lower lows observed in the data suggest persistent selling pressure. Traders may need to be cautious and monitor key support levels that could determine potential reversals or continued downtrends.
| Level | Price |
|---|---|
| 0.236 | 1.36911 |
| 0.382 | 1.38127 |
| 0.5 | 1.38808 |
| 0.618 | 1.39489 |
| 0.786 | 1.40436 |
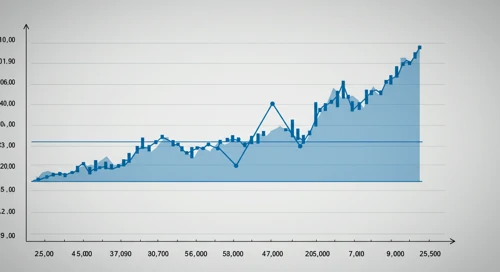
Responsive chart showing recent price movements of USDCAD
## Conclusion The recent trend in USDCAD highlights potential risks, as the pair remains within a bearish framework. Traders should be cautious of downside risks, especially if the current price struggles to surpass the immediate Fibonacci resistance of 0.236. However, should the price manage to break through these retracement levels, it could lead to a bullish reversal, offering lucrative opportunities. Continuous monitoring of these levels can provide critical insights for future trading decisions.