September 01, 2025 a 05:08 am
USDCAD: Fibonacci Analysis
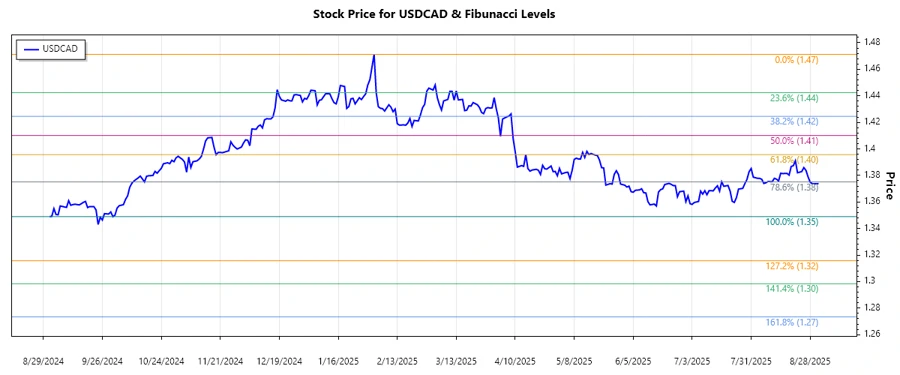
The USDCAD currency pair has witnessed significant movements, predominantly displaying a downward trend over the past months. The Canadian dollar has gained strength against its US counterpart, influenced by global economic conditions and commodity prices. This trend could suggest potential opportunities for traders who monitor support and resistance levels. However, cautious evaluation of the market dynamics and external economic factors remains essential.
Fibonacci Analysis
| Feature | Details |
|---|---|
| Trend Type | Downtrend |
| Start Date | 2024-09-01 |
| End Date | 2025-09-01 |
| High Point | 1.4712 (2025-02-02) |
| Low Point | 1.34893 (2024-10-01) |
Fibonacci Retracement Levels
| Level | Price |
|---|---|
| 0.236 | 1.445657 |
| 0.382 | 1.429196 |
| 0.5 | 1.410065 |
| 0.618 | 1.390934 |
| 0.786 | 1.365667 |
Current Price is within the retracement level of 0.786, indicating a possible support area where the price could stabilize or rebound.
This level could act as a short-term support, potentially reversing the recent downtrend if sustained; otherwise, further decline may be expected.
Conclusion
The USDCAD has experienced a significant downtrend, indicating the Canadian dollar's strength against the US dollar. This downward movement has reached potential support levels, identified through Fibonacci retracement. Analysts should consider this as a possible reversal opportunity unless the price breaches the identified support zones. While opportunities exist, risks associated with volatility and macroeconomic factors should not be overlooked. Observing economic indicators relevant to both the US and Canada is crucial for a comprehensive analysis. Overall, the technical outlook presents mixed potential, subject to ongoing market evaluations.
Smart Data Insight
Master the Perfect Entry & Exit for this Stock
Don't leave your profits to chance. Historically, this stock follows specific seasonal patterns that institutional traders use to maximize returns.
- ✅ Identify the "Golden Buying Window"
- ✅ Avoid high-risk correction cycles
- ✅ Backtested data from the last 20+ years