
June 28, 2026 a 08:15 am
USB: Trend and Support & Resistance Analysis - U.S. Bancorp
The U.S. Bancorp (USB) stock has exhibited resilience over the past months, evidencing a moderate upward trajectory. Leveraging an extensive network and a diverse service portfolio, USB remains a solid play amidst banking stocks. While immediate resistance and support levels will test this trend, investors could find value in the company's consistent performance metrics. Market dynamics could influence potential risks, such as interest rate shifts. Carefully calibrated strategies should allow USB to leverage its strengths in the financial sector.
Trend Analysis
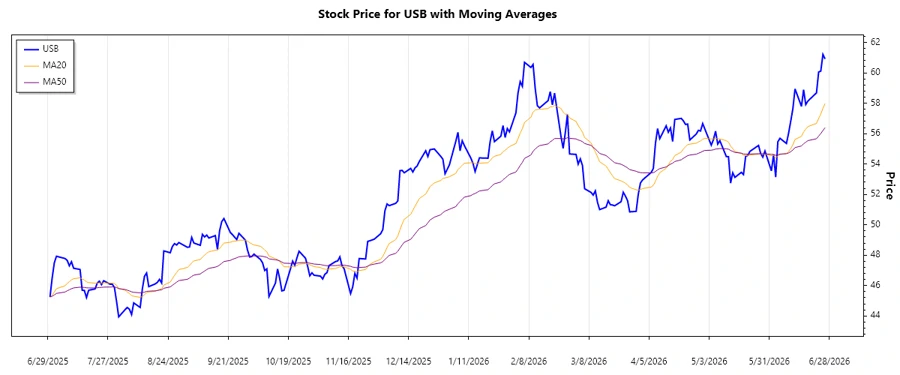
This analysis focuses on U.S. Bancorp's stock trend utilizing the EMA20 and EMA50 to understand momentum and trend direction. Calculations show:
| Date | Close Price | Trend |
|---|---|---|
| 2026-06-26 | 60.91 | ▲ (Uptrend) |
| 2026-06-25 | 61.21 | ▲ (Uptrend) |
| 2026-06-24 | 60.11 | ▲ (Uptrend) |
| 2026-06-23 | 60.05 | ▲ (Uptrend) |
| 2026-06-22 | 58.68 | ▲ (Uptrend) |
| 2026-06-18 | 58.14 | ▲ (Uptrend) |
| 2026-06-17 | 57.91 | ▲ (Uptrend) |
The recent uptrend as indicated by EMA20 exceeding EMA50 points to a positive momentum. It's crucial for investors to monitor these trends for potential market entry or exit opportunities.
Support and Resistance
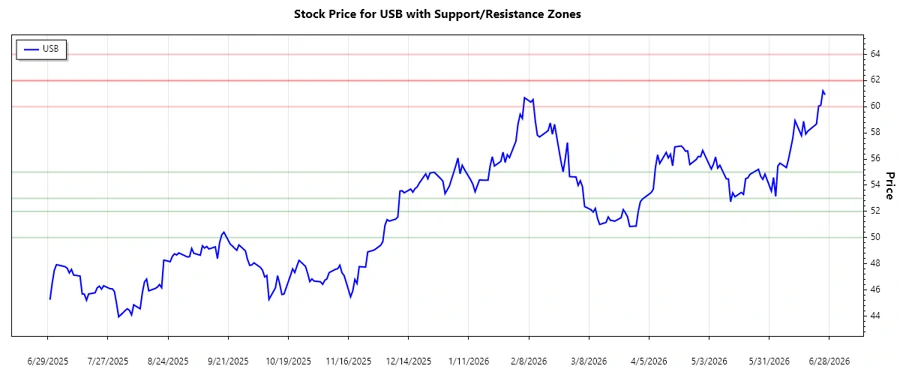
By analyzing closing prices, key support and resistance zones are identified as follows:
| Type | Zone Range |
|---|---|
| Support Zone 1 | 53.00 – 55.00 ▲ |
| Support Zone 2 | 50.00 – 52.00 ▲ |
| Resistance Zone 1 | 62.00 – 64.00 ▼ |
| Resistance Zone 2 | 60.00 – 62.00 ▼ |
Currently, the stock price flirts with the lower bounds of the nearest resistance zone, indicating a crucial juncture. A breakthrough could precipitate further gains, although failure might redirect prices to recent support zones.
Conclusion
U.S. Bancorp stands resilient amidst fluctuating market conditions, demonstrating considerable fortitude thanks to a robust business framework. While short-term volatility is expected, the current trend reflects optimism. Challenges such as regulatory shifts and economic changes could impact future performance; nonetheless, the bank's diversification offers a buffer against isolated downsides. Analysts should focus on breaking resistance levels as indicators of momentum shifts. The prevailing upward trend suggests a reinforcing investor sentiment, albeit the need for cautious optimism prevails.
Smart Data Insight
Master the Perfect Entry & Exit for this Stock
Don't leave your profits to chance. Historically, this stock follows specific seasonal patterns that institutional traders use to maximize returns.
- ✅ Identify the "Golden Buying Window"
- ✅ Avoid high-risk correction cycles
- ✅ Backtested data from the last 20+ years