November 08, 2025 a 03:15 am

USB: Trend and Support & Resistance Analysis - U.S. Bancorp
The U.S. Bancorp stock shows fluctuating movements over the past few months, affected by market conditions and economic changes. Recent data suggests a possible slight downtrend, with key support and resistance levels providing insight into future price movements. Investors should consider technical signals before making investment decisions in this stock.
Trend Analysis
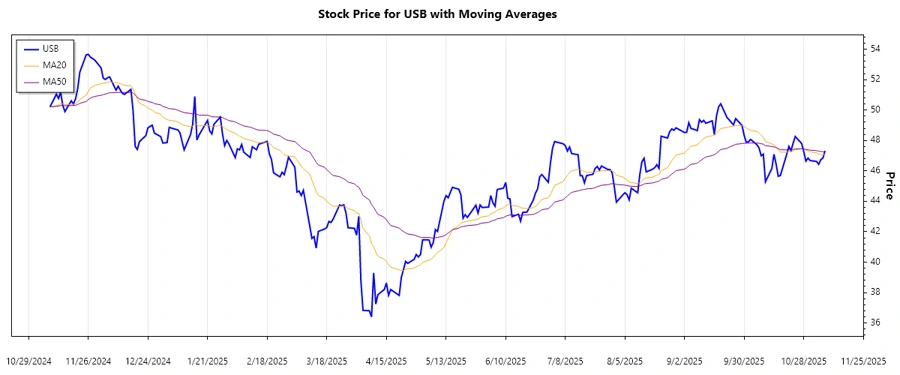
The stock of U.S. Bancorp has shown varied trends recently. Based on the calculated EMAs from the closing prices, we observe the following:
| Date | Close Price | Trend |
|---|---|---|
| 2025-11-07 | $47.32 | ⚖️ |
| 2025-11-06 | $46.85 | ▼ |
| 2025-11-05 | $46.74 | ▼ |
| 2025-11-04 | $46.43 | ▼ |
| 2025-11-03 | $46.62 | ▼ |
| 2025-10-31 | $46.68 | ▼ |
| 2025-10-30 | $46.84 | ⚖️ |
From the analysis, the price is currently in a downtrend, indicated by EMA20 being below EMA50. This signals a bearish sentiment with possible consolidations ahead. The market conditions need to change significantly to reverse the current trend.
Support and Resistance
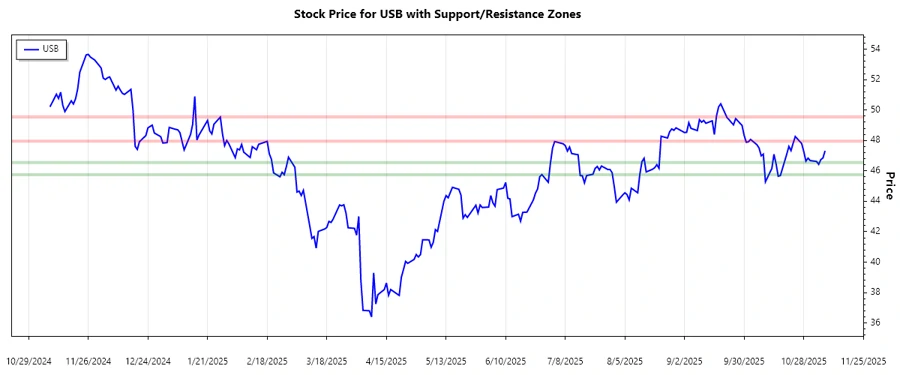
The following support and resistance zones have been identified:
| Type | Zone | Status |
|---|---|---|
| Support | $46.50 - $46.60 | ⚊ |
| Support | $45.70 - $45.80 | ⚊ |
| Resistance | $47.90 - $48.00 | ▼ |
| Resistance | $49.50 - $49.60 | ▼ |
The current price sits just above the lower support zone of $46.50 - $46.60, which signifies potential stabilization or future upward attempts. However, overcoming the identified resistance may pose challenges.
Conclusion
The analysis of U.S. Bancorp's stock highlights a current bearish trend with a potential for near-term support at the $46.50 - $46.60 zone. Key resistance levels identify where bullish movement may face challenges. Investors should remain cautious and consider market volatility and economic factors. The stock's movement within these zones can give insights into the potential breakout or breakdown, signaling strategic entry or exit points for traders.