October 17, 2025 a 02:03 pm### USB: Trend and Support & Resistance Analysis - U.S. Bancorp
 ### Trend Analysis
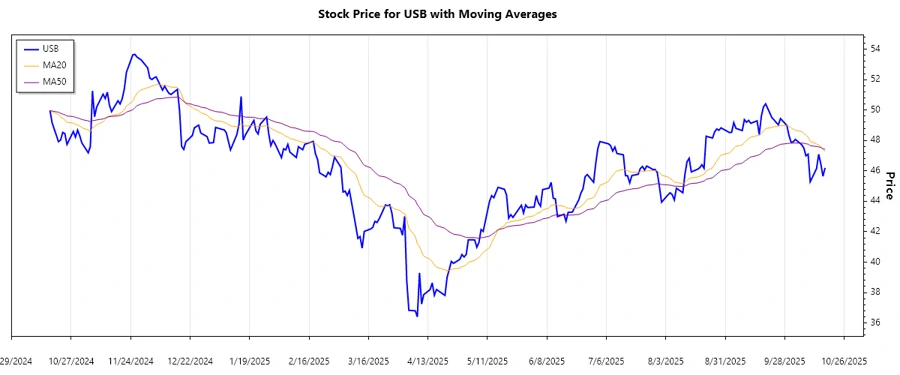
To understand the recent trend of U.S. Bancorp's stock, we calculated the 20-day and 50-day Exponential Moving Averages (EMA). Recent data indicates a subtle shift: the EMA20 (47.65) is just below the EMA50 (47.87), suggesting a weak downward trend.
### Trend Analysis
To understand the recent trend of U.S. Bancorp's stock, we calculated the 20-day and 50-day Exponential Moving Averages (EMA). Recent data indicates a subtle shift: the EMA20 (47.65) is just below the EMA50 (47.87), suggesting a weak downward trend.
Despite minor fluctuations, the predominant trend showcases a downward trajectory over the recent days. This assessment can guide investors in optimizing their positions.
 ### Support and Resistance
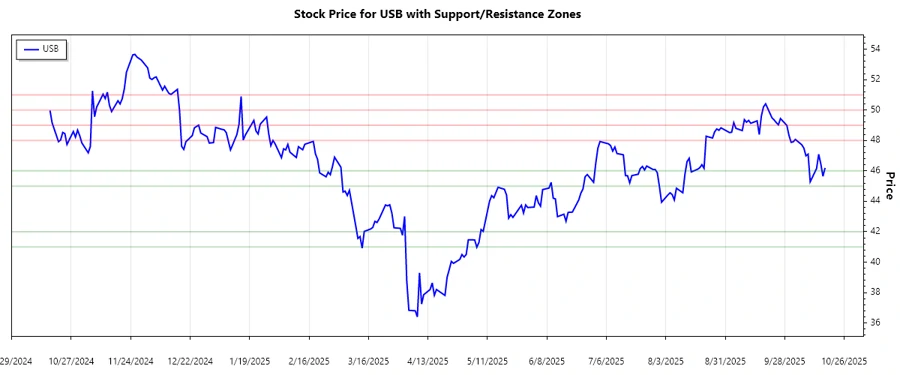
Support and resistance lines are critical for determining potential stock performance thresholds. Based on the daily closing prices, we identified the following zones:
### Support and Resistance
Support and resistance lines are critical for determining potential stock performance thresholds. Based on the daily closing prices, we identified the following zones:
Currently, the stock hovers near the lower support zone, indicating a potential premium for cautious investors amid a wider market sell-off. Monitoring these price points ensures tactical portfolio adjustments.
 ### Conclusion
U.S. Bancorp’s stock portrays a challenging technical outlook with imminent resistance levels; however, underlying support provides a safety net. Market participants should stay vigilant of macroeconomic indicators and company-specific news. Overall, the stock exhibits prudent upside potential with an underlying risk factor. If performance aligns with anticipated financial metrics, a nuanced strategic entry could offer worthwhile gains. Caution advised as market conditions are variable.
### Conclusion
U.S. Bancorp’s stock portrays a challenging technical outlook with imminent resistance levels; however, underlying support provides a safety net. Market participants should stay vigilant of macroeconomic indicators and company-specific news. Overall, the stock exhibits prudent upside potential with an underlying risk factor. If performance aligns with anticipated financial metrics, a nuanced strategic entry could offer worthwhile gains. Caution advised as market conditions are variable.
U.S. Bancorp has exhibited a complex trend over the past months, with fluctuations influenced by macroeconomic factors and internal corporate developments. Despite recent volatility, the stock shows potential for recovery. Investors should pay close attention to the upcoming quarterly results and industry conditions to gauge future movements.
| Date | Close Price | Trend |
|---|---|---|
| 2025-10-17 | 46.195 | ▼ |
| 2025-10-16 | 45.65 | ▲ |
| 2025-10-15 | 46.45 | ▲ |
| 2025-10-14 | 47.09 | ▲ |
| 2025-10-13 | 46.16 | ▼ |
| 2025-10-10 | 45.28 | ▼ |
| 2025-10-09 | 47.10 | ▲ |
### Support and Resistance
Support and resistance lines are critical for determining potential stock performance thresholds. Based on the daily closing prices, we identified the following zones:
| Type | Zone From | Zone To |
|---|---|---|
| Support | 45.00 | 46.00 |
| Support | 41.00 | 42.00 |
| Resistance | 48.00 | 49.00 |
| Resistance | 50.00 | 51.00 |
### Conclusion
U.S. Bancorp’s stock portrays a challenging technical outlook with imminent resistance levels; however, underlying support provides a safety net. Market participants should stay vigilant of macroeconomic indicators and company-specific news. Overall, the stock exhibits prudent upside potential with an underlying risk factor. If performance aligns with anticipated financial metrics, a nuanced strategic entry could offer worthwhile gains. Caution advised as market conditions are variable.
Smart Data Insight
Master the Perfect Entry & Exit for this Stock
Don't leave your profits to chance. Historically, this stock follows specific seasonal patterns that institutional traders use to maximize returns.
- ✅ Identify the "Golden Buying Window"
- ✅ Avoid high-risk correction cycles
- ✅ Backtested data from the last 20+ years