
July 16, 2026 a 06:44 am
USB: Fibonacci Analysis - U.S. Bancorp
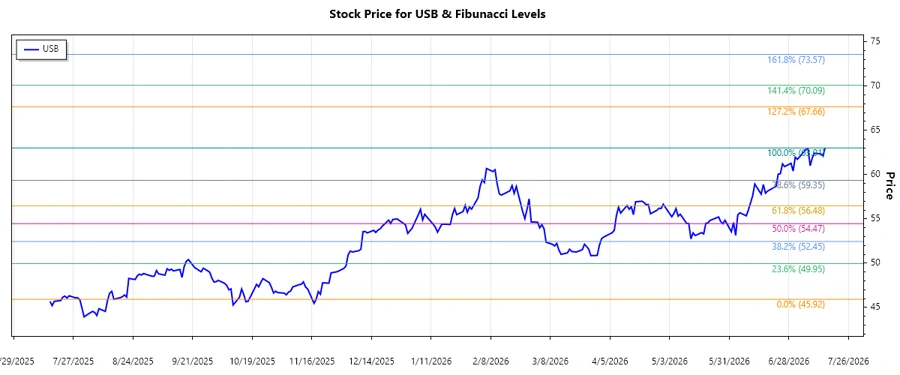
U.S. Bancorp (USB) has shown a significant upward trend in the recent months. This financial institution, with its extensive range of services, appears to be benefiting from an improved economic environment and increased demand for financial services. The analysis suggests the stock is on a positive trajectory, with potential support levels emerging at key retracement zones. Investors might consider observing these levels closely for strategic entry points.
Fibonacci Analysis
The recent trend observed for U.S. Bancorp (USB) is an upward trend. From the provided data, we calculate the relevant Fibonacci retracement levels to identify potential support zones should the stock price retract from its recent highs.
| Detail | Value |
|---|---|
| Trend Start Date | 2025-11-18 |
| Trend End Date | 2026-07-15 |
| High Point | $63.01 on 2026-07-15 |
| Low Point | $45.92 on 2025-11-18 |
| Fibonacci 0.236 Level | $58.95 |
| Fibonacci 0.382 Level | $55.69 |
| Fibonacci 0.5 Level | $54.47 |
| Fibonacci 0.618 Level | $53.26 |
| Fibonacci 0.786 Level | $51.43 |
| Current Price Position | Currently, the price is within the 0.382 retracement zone. |
| Interpretation | This level may act as a significant support if the price descends, indicating a potential buying opportunity for investors. |
Conclusion
U.S. Bancorp's recent upward trajectory highlights the company's strong market position and resilience. The stock has potential support at Fibonacci retracement levels, particularly at the 0.382 level, where the price currently resides. While this suggests potential entry points, investors should be wary of broader economic factors that could impact bank stocks. Continuous monitoring of price movements and industry news is crucial for making informed investment decisions. The identified support zones serve as critical junctures for assessing market conditions.
Smart Data Insight
Master the Perfect Entry & Exit for this Stock
Don't leave your profits to chance. Historically, this stock follows specific seasonal patterns that institutional traders use to maximize returns.
- ✅ Identify the "Golden Buying Window"
- ✅ Avoid high-risk correction cycles
- ✅ Backtested data from the last 20+ years