March 15, 2026 a 11:44 am
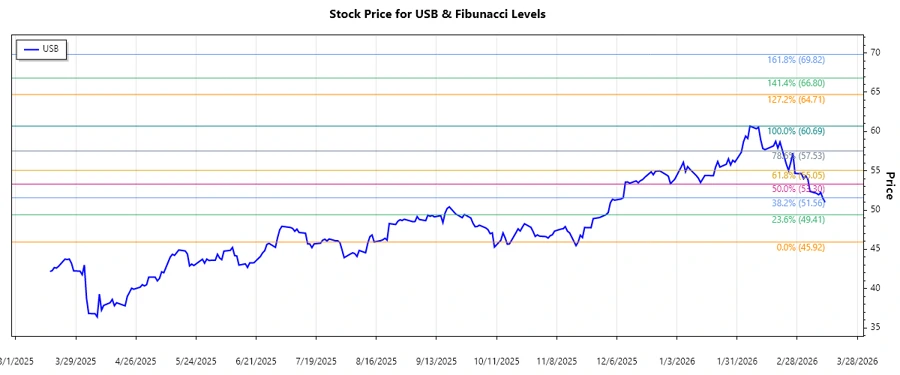
USB: Fibonacci Analysis - U.S. Bancorp
U.S. Bancorp has exhibited a notable uptrend over recent months, indicating positive momentum. The company's diversified financial services are well-positioned in a competitive market sector. Despite economic fluctuations, their robust financial health and strategic initiatives provide a promising outlook. Investors should be mindful of potential market volatility, but overall, the stock presents a positive investment prospect. Tactical analysis suggests a careful watch on support levels as opportunities present themselves.
Fibonacci Analysis
| Detail | Value | ||||||||||||
|---|---|---|---|---|---|---|---|---|---|---|---|---|---|
| Start Date | 2025-11-19 | ||||||||||||
| End Date | 2026-03-13 | ||||||||||||
| High Price (2025-02-09) | $60.69 | ||||||||||||
| Low Price (2025-11-19) | $45.92 | ||||||||||||
| Fibonacci Levels |
|
||||||||||||
| Current Price (2026-03-13) | $51.00 | ||||||||||||
| Retracement Zone | 0.236 | ||||||||||||
| Interpretation | The current price suggests a slight retracement within the 0.236 Fibonacci level, indicating potential for bullish support at this level. |
Conclusion
U.S. Bancorp's stock demonstrates a strong upward momentum, bolstered by solid fundamentals and market positioning. While the current price suggests a minor pullback at key Fibonacci levels, which traditionally act as support, investors should remain vigilant for market shifts. The strategic expansion and reliable revenue streams underscore a stable future outlook. Both macroeconomic factors and interest rates could pose risks, but the general trend signals a robust buy opportunity. Analysts should monitor the stock closely for breakout signals or further consolidation within Fibonacci retracement zones.