October 10, 2025 a 04:45 pm
USB: Fibonacci Analysis - U.S. Bancorp
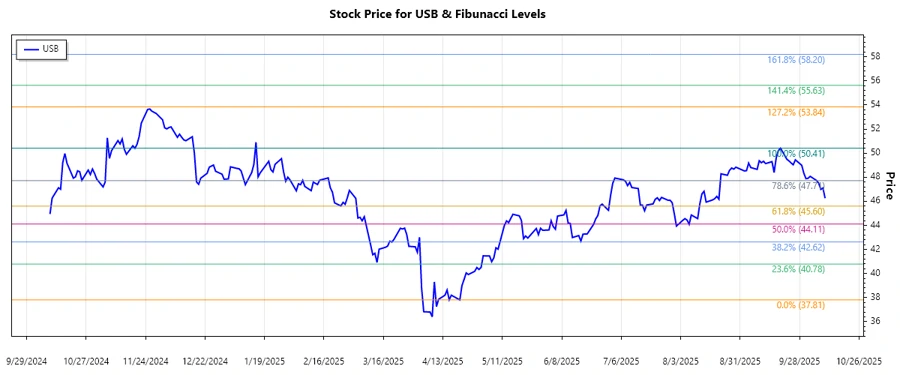
The U.S. Bancorp (USB) stock has shown significant fluctuations over the analyzed period. As one of the largest financial services providers in the U.S., its performance is crucial for investors to understand the current market dynamics. The stock has experienced varied trends, with a dominant pattern observed over the past months. Understanding the Fibonacci retracement levels will provide insights into potential future movements and investment opportunities.
Fibonacci Analysis
| Detail | Data |
|---|---|
| Start Date | 2025-04-21 |
| End Date | 2025-09-19 |
| Highest Price | $50.41 (2025-09-19) |
| Lowest Price | $37.81 (2025-04-21) |
| Fibonacci 0.236 | $41.20 |
| Fibonacci 0.382 | $44.03 |
| Fibonacci 0.5 | $46.11 |
| Fibonacci 0.618 | $48.18 |
| Fibonacci 0.786 | $50.67 |
| Current Price | $46.255 |
| Retracement Zone | 0.5 |
| Interpretation | The current price is within the 50% retracement zone, suggesting potential support and the possibility of a reversal upward. |
Conclusion
The recent analysis of U.S. Bancorp's stock indicates that the price has undergone notable changes, leading to a 50% retracement according to Fibonacci analysis. This positions the stock in a potential support zone, where investors might expect a rebound. However, given the volatile nature of the market and macroeconomic factors influencing financial institutions, there's both an opportunity for upward movement and a risk of further declines. Investors should weigh these possibilities, considering both external economic forecasts and internal financial health indicators of U.S. Bancorp.
Smart Data Insight
Master the Perfect Entry & Exit for this Stock
Don't leave your profits to chance. Historically, this stock follows specific seasonal patterns that institutional traders use to maximize returns.
- ✅ Identify the "Golden Buying Window"
- ✅ Avoid high-risk correction cycles
- ✅ Backtested data from the last 20+ years