August 04, 2025 a 10:15 am
USB: Fibunacci Analysis - U.S. Bancorp
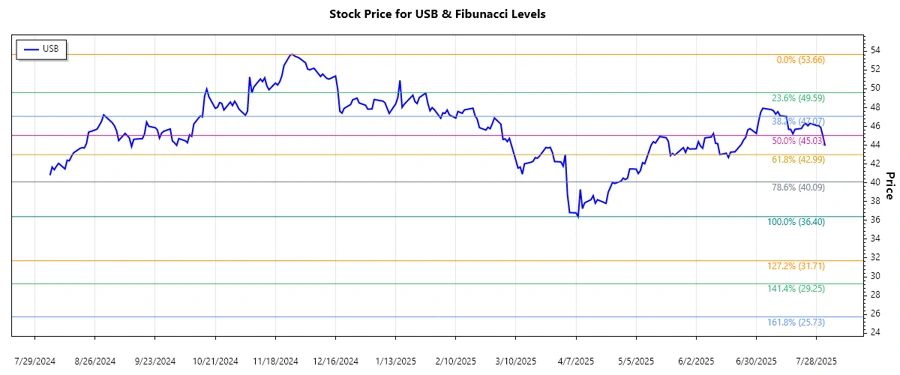
The U.S. Bancorp (USB) has shown a predominantly upward trend in recent months despite some fluctuations. The stock's performance is a reflection of robust financial services offerings, steady demand in consumer banking, and expanding digital platforms, which together fuel corporate stability. Nevertheless, potential risks include economic slowdowns and tighter regulatory scrutiny.
Fibonacci Analysis
| Analysis Detail | Value |
|---|---|
| Trend Start Date | 2024-08-05 |
| Trend End Date | 2025-08-01 |
| Highest Price | $53.66 on 2024-11-26 |
| Lowest Price | $36.40 on 2025-04-08 |
| Fibonacci Level | Price Level |
|---|---|
| 0.236 | $41.44 |
| 0.382 | $45.36 |
| 0.5 | $48.03 |
| 0.618 | $50.70 |
| 0.786 | $53.09 |
The current price of $43.94 as of 2025-08-01 rests between the 0.236 and 0.382 Fibonacci retracement levels, indicating a potential support zone.
Technically, the 0.382 Fibonacci level serves as a significant support, suggesting stabilization in the stock’s corrective movement. Investors may see retracement as an opportunity for new entries.
Conclusion
U.S. Bancorp's stock has demonstrated resilience in an upward trend, driven by its robust financial health and market strategies. The Fibonacci analysis suggests potential near-term stabilization, with crucial support around the $45.36 mark. While opportunities for gains remain, risks include broader economic conditions and regulatory pressures. Analysts may view current price levels as strategic entry points, anticipating further growth, subject to external economic factors.
Smart Data Insight
Master the Perfect Entry & Exit for this Stock
Don't leave your profits to chance. Historically, this stock follows specific seasonal patterns that institutional traders use to maximize returns.
- ✅ Identify the "Golden Buying Window"
- ✅ Avoid high-risk correction cycles
- ✅ Backtested data from the last 20+ years