April 11, 2026 a 11:31 am

USB: Dividend Analysis - U.S. Bancorp
U.S. Bancorp offers a compelling dividend profile with a yield above the industry average. The bank has displayed consistent dividend growth over the years, bolstered by a stable payout ratio. While the payout ratios and leverage metrics suggest a cautious approach to debt management, the company maintains a robust dividend history.
📊 Overview
Understanding U.S. Bancorp's sector and current dividend statistics provides insights into its market positioning and shareholder return strategy.
| Metric | Value |
|---|---|
| Sector | Financial Services |
| Dividend yield | 3.96% |
| Current dividend per share | 2.25 USD |
| Dividend history | 43 years |
| Last cut or suspension | None |
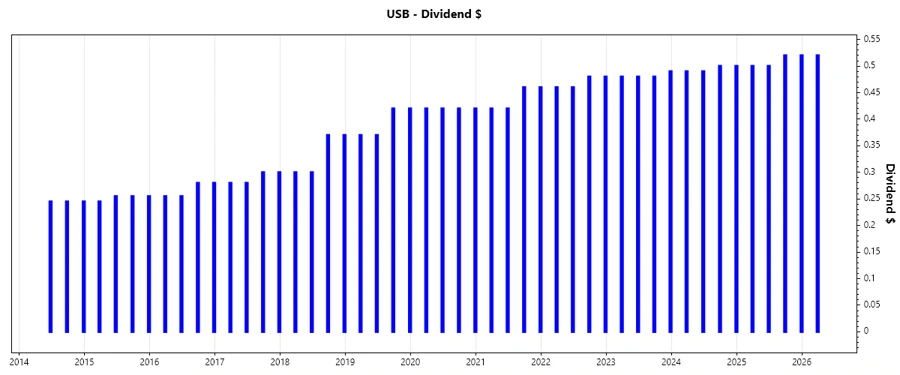
📜 Dividend History
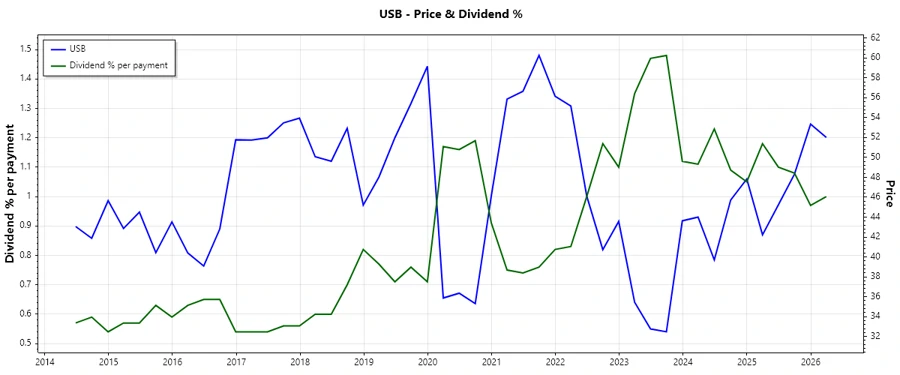
Dividend history reflects U.S. Bancorp's commitment to returning value to its shareholders. A long history showcases stability and trustworthiness in payouts.
| Year | Dividend per Share (USD) |
|---|---|
| 2026 | 0.52 |
| 2025 | 2.04 |
| 2024 | 1.98 |
| 2023 | 1.93 |
| 2022 | 1.88 |
📈 Dividend Growth
The dividend growth rates over the past 3 and 5 years indicate a cautious yet steady increase, ensuring long-term sustainability.
| Time | Growth |
|---|---|
| 3 years | 2.76% |
| 5 years | 3.96% |
The average dividend growth is 3.96% over 5 years. This shows moderate but steady dividend growth.
💰 Payout Ratio
The payout ratio illustrates the portion of earnings distributed as dividends and is crucial for assessing dividend sustainability.
| Key figure | Ratio |
|---|---|
| EPS-based | 46.22% |
| Free cash flow-based | 43.90% |
An EPS payout ratio of 46.22% and FCF payout ratio of 43.90% indicate a balanced approach, allowing for both reinvestment and shareholder returns.
🗣️ Cashflow & Capital Efficiency
Analysis of cash flow and capital efficiency highlights U.S. Bancorp's operational proficiency and strategic allocation of resources.
| Year | 2023 | 2024 | 2025 |
|---|---|---|---|
| Free Cash Flow Yield | 12.65% | 15.11% | 9.61% |
| Earnings Yield | 8.13% | 8.44% | 9.13% |
| CAPEX to Operating Cash Flow | 0% | 0% | 0% |
| Stock-based Compensation to Revenue | 0% | 0% | 0% |
| Free Cash Flow / Operating Cash Flow Ratio | 1 | 1 | 1 |
Strong cash flow performance supports a sustainable dividend policy.
🔍 Balance Sheet & Leverage Analysis
Understanding leverage and balance sheet metrics is essential for assessing financial risk and stability.
| Year | 2023 | 2024 | 2025 |
|---|---|---|---|
| Debt-to-Equity | 1.21 | 1.26 | 1.20 |
| Debt-to-Assets | 10.06% | 10.84% | 11.26% |
| Debt-to-Capital | 54.69% | 55.66% | 54.45% |
| Net Debt to EBITDA | 0.71 | 1.92 | 3.02 |
| Current Ratio | 0.26 | 0.28 | 0.26 |
| Quick Ratio | 0.26 | 0.28 | 0.26 |
| Financial Leverage | 11.99 | 11.58 | 10.62 |
U.S. Bancorp maintains leverage at sustainable levels, mitigating financial risk.
🧮 Fundamental Strength & Profitability
Fundamental strength and profitability metrics are crucial indicators of overall business health and efficiency.
| Year | 2023 | 2024 | 2025 |
|---|---|---|---|
| Return on Equity | 9.82% | 10.75% | 11.62% |
| Return on Assets | 0.82% | 0.93% | 1.09% |
| Margins: Net | 13.36% | 14.75% | 17.68% |
| EBIT | 16.90% | 18.52% | 22.20% |
| EBITDA | 19.40% | 20.71% | 24.01% |
| Gross | 63.36% | 58.76% | 62.83% |
| Research & Development to Revenue | 0% | 0% | 0% |
Robust return on equity and asset metrics underline strong profitability and business efficiency.
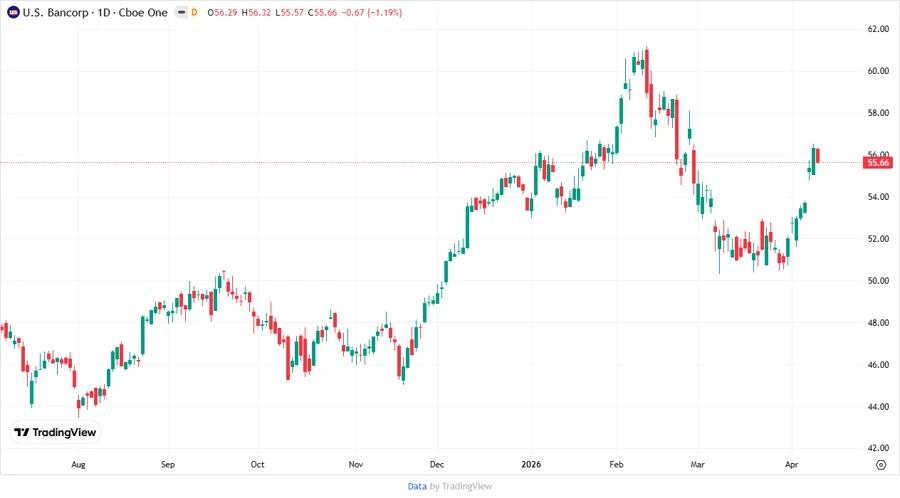
💹 Price Development
✅ Dividend Scoring System
| Criterion | Score | Indicator |
|---|---|---|
| Dividend Yield | 4 | |
| Dividend Stability | 5 | |
| Dividend Growth | 3 | |
| Payout Ratio | 4 | |
| Financial Stability | 4 | |
| Dividend Continuity | 5 | |
| Cashflow Coverage | 5 | |
| Balance Sheet Quality | 4 |
Total Score: 34/40
🔍 Rating
U.S. Bancorp's dividend profile is impressive, characterized by good yield, stable payout ratios, and a formidable dividend history. With strong fundamentals and manageable leverage levels, the company is positioned favorably for investors seeking consistent income. The recommendation is to consider U.S. Bancorp a reliable dividend stock with potential for capital appreciation.