February 27, 2026 a 07:46 am


USB: Dividend Analysis - U.S. Bancorp
U.S. Bancorp presents a formidable dividend profile with a rich history of consistent payouts over the past decades. The bank's strategic dividend approach reinforces its stability and commitment to shareholders. As a resilient institution, U.S. Bancorp continues to prioritize shareholder returns while maintaining a robust financial standing.
Overview
| Metric | Details |
|---|---|
| Sector | Financial Services |
| Dividend Yield | 3.82% |
| Current Dividend per Share | 2.02 USD |
| Dividend History | 42 years |
| Last Cut or Suspension | 2009 |
Dividend History
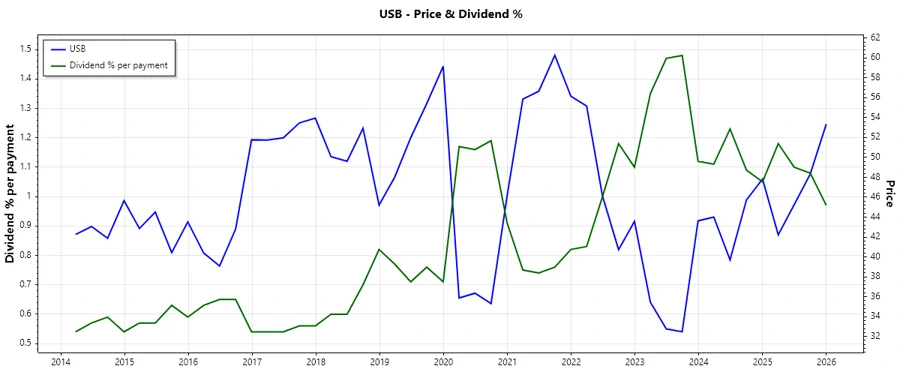
The consistency in U.S. Bancorp’s dividend payments illustrates its unwavering commitment to providing shareholder value. This longstanding tradition is a testament to the company's financial vigor and strategic vision. Understanding historical dividend payments is key to evaluating future expectations and stability.
| Year | Dividend per Share (USD) |
|---|---|
| 2025 | 2.04 |
| 2024 | 1.98 |
| 2023 | 1.93 |
| 2022 | 1.88 |
| 2021 | 1.76 |
Dividend Growth
The growth rate of dividends is pivotal in assessing the potential for future income enhancements from an investor’s standpoint. This metric reflects the sustainability and promise of increased returns.
| Time | Growth |
|---|---|
| 3 years | 2.76% |
| 5 years | 3.96% |
The average dividend growth is 3.96% over 5 years. This shows moderate but steady dividend growth.
Payout Ratio
The payout ratios indicate how well U.S. Bancorp supports its dividend payments through its earnings and cash flow. Evaluating these metrics helps ascertain the viability and safety of dividends.
| Key Figure | Ratio |
|---|---|
| EPS-based | 41.46% |
| Free Cash Flow-based | 61.18% |
A payout ratio of 41.46% based on EPS and 61.18% based on FCF suggests a sustainable dividend supported by both earnings and cash flow.
Cashflow & Capital Efficiency
Cashflow and capital efficiency are crucial for maintaining company operations and strategic investments. They are fundamental indicators of financial health and operational success.
| Metric | 2025 | 2024 | 2023 |
|---|---|---|---|
| Free Cash Flow Yield | N/A | 15.11% | 12.65% |
| Earnings Yield | 9.13% | 8.44% | 8.13% |
| CAPEX to Operating Cash Flow | 0% | 0% | 0% |
| Stock-based Compensation to Revenue | 0% | 0% | 0% |
| Free Cash Flow / Operating Cash Flow Ratio | N/A | 1 | 1 |
The positive cash flow yields and low CAPEX indicate efficient cash utilization, supporting continued operations and strategic outlays.
Balance Sheet & Leverage Analysis
An assessment of leverage metrics and balance sheet strength is critical in determining financial solvency and the ability to meet obligations while pursuing growth.
| Metric | 2025 | 2024 | 2023 |
|---|---|---|---|
| Debt-to-Equity | 1.20 | 1.26 | 1.21 |
| Debt-to-Assets | 11.26% | 10.84% | 10.06% |
| Debt-to-Capital | 54.45% | 55.66% | 54.69% |
| Net Debt to EBITDA | 3.02 | 1.92 | 0.71 |
| Current Ratio | 2.73 | 0.28 | 0.26 |
| Quick Ratio | 2.73 | 0.28 | 0.26 |
| Financial Leverage | 10.62 | 11.58 | 12.00 |
The stable leverage ratios indicate a balanced financial structure capable of supporting its existing liabilities and potential strategic opportunities.
Fundamental Strength & Profitability
Profitability and fundamental strength measures offer insights into operational efficiency and long-term business sustainability.
| Metric | 2025 | 2024 | 2023 |
|---|---|---|---|
| Return on Equity | 11.62% | 10.75% | 9.82% |
| Return on Assets | 1.09% | 0.93% | 0.82% |
| Margins: Net | 17.68% | 14.75% | 13.36% |
| EBIT Margin | 22.20% | 18.52% | 16.90% |
| EBITDA Margin | 24.01% | 20.71% | 19.40% |
| Gross Margin | 62.83% | 58.76% | 63.36% |
| Research & Development to Revenue | 0% | 0% | 0% |
The robust profitability margins and efficiencies indicate a disciplined resource management strategy primed for continued value creation.
Dividend Scoring System
| Category | Score | Score Bar |
|---|---|---|
| Dividend Yield | 4 | |
| Dividend Stability | 5 | |
| Dividend Growth | 3 | |
| Payout Ratio | 4 | |
| Financial Stability | 4 | |
| Dividend Continuity | 5 | |
| Cashflow Coverage | 4 | |
| Balance Sheet Quality | 4 |
Total Score: 33 / 40
Rating
U.S. Bancorp maintains a solid and stable dividend profile, demonstrating strong financial health and management acumen. With consistent cash flow and established profitability, the company is well-positioned for sustainable returns. Investors seeking reliable income streams should find U.S. Bancorp an attractive proposition in the financial sector. The bank’s resilient performance amid economic cycles underscores its potential as a prudent dividend investment.