September 26, 2025 a 03:15 am
URI: Trend and Support & Resistance Analysis - United Rentals, Inc.
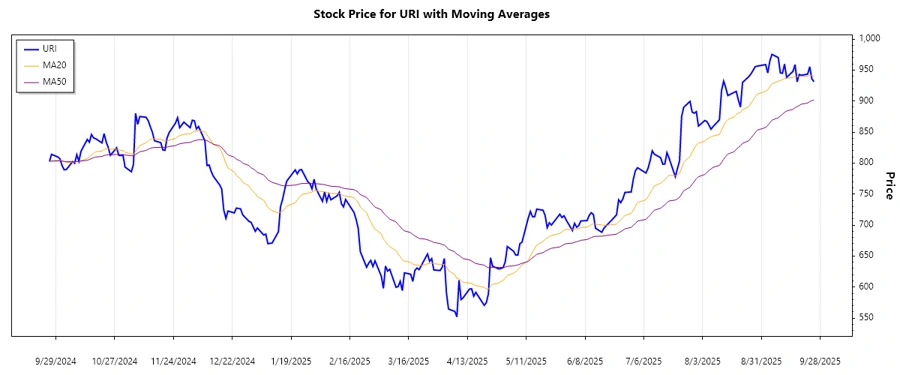
United Rentals, Inc. (URI) has shown dynamic movement in its stock price over recent months. The company, a leader in the equipment rental industry, has been affected by both internal and external factors which influence its market performance. Recent data suggests key areas for both support and resistance, offering potential opportunities for traders. Identifying the current trend is essential for developing strategic entry and exit points in the market. An analysis of moving averages can provide insight into the potential future direction of URI stock.
Trend Analysis
| Date | Closing Price | Trend |
|---|---|---|
| 2025-09-25 | $931.25 | ▼ |
| 2025-09-24 | $935.78 | ▼ |
| 2025-09-23 | $955.22 | ▲ |
| 2025-09-22 | $943.42 | ▲ |
| 2025-09-19 | $941.52 | ▼ |
| 2025-09-18 | $942.79 | ▲ |
| 2025-09-17 | $931.01 | ▼ |
The EMA20 is currently higher than the EMA50, indicating a moderate upward trend. However, fluctuations in the daily prices suggest volatility, and caution is advised for traders.
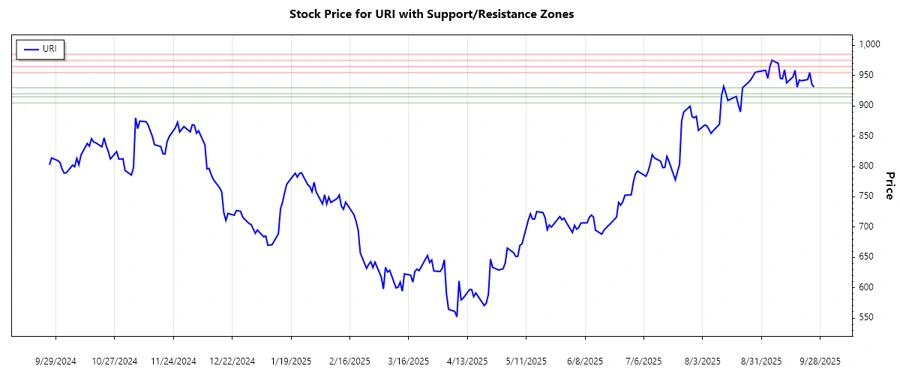
Support and Resistance
| Zone | From | To |
|---|---|---|
| Support 1 | $920.00 | $930.00 |
| Support 2 | $905.00 | $915.00 |
| Resistance 1 | $955.00 | $965.00 |
| Resistance 2 | $975.00 | $985.00 |
Currently, the stock price is within the first resistance zone, suggesting potential for a breakout if the upward trend persists. Monitoring is essential to make informed decisions.
Conclusion
Overall, United Rentals, Inc. is showcasing a dynamic market performance with certain periods of volatility. The trend analysis points to an upward movement; however, occasional slides must be considered by investors. Support and resistance zones suggest price points for strategic trading. As always, careful observation and analysis of market conditions are critical for successful trading. The company’s position as a market leader in equipment rentals may offer competitive advantages amidst external market pressures.
Smart Data Insight
Master the Perfect Entry & Exit for this Stock
Don't leave your profits to chance. Historically, this stock follows specific seasonal patterns that institutional traders use to maximize returns.
- ✅ Identify the "Golden Buying Window"
- ✅ Avoid high-risk correction cycles
- ✅ Backtested data from the last 20+ years