February 08, 2026 a 06:44 am
URI: Fibonacci Analysis - United Rentals, Inc.
United Rentals, Inc. (URI) has shown a strong performance over the past few months. The company specializes in equipment rental with a focus on general construction and specialty segments. Its broad geographic presence and diverse offerings help stabilize revenue streams. Recent trends suggest that URI may be poised for further growth, yet market conditions remain a critical factor.
Fibonacci Analysis
| Start Date | End Date | High Price | High Date | Low Price | Low Date |
|---|---|---|---|---|---|
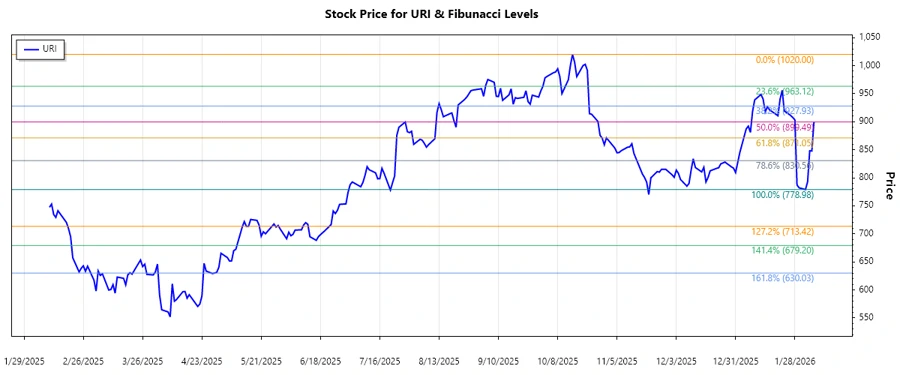
| 2025-10-14 | 2026-02-02 | 1020.00 | 2025-10-15 | 778.98 | 2026-02-02 |
Fibonacci Levels
| Level | Price |
|---|---|
| 0.236 | 876.29 |
| 0.382 | 904.67 |
| 0.5 | 924.49 |
| 0.618 | 944.31 |
| 0.786 | 971.69 |
The current price is within the 0.236 and 0.382 retracement zone. This suggests a potential support level around 876.29, with a possibility for the price to bounce back. If the price fails to hold above this level, it may seek further support at the next Fibonacci level.
Conclusion
The upward trend in URI stock reflects the company's ability to adapt to market demands, which is a positive signal for investors. However, with minor retracement levels being tested, there is a risk of potential further declines if buyers do not step in. If the stock holds at current support levels, it could provide a robust buying opportunity. Analysts must monitor economic conditions and sector trends closely to understand the potential impacts on URI. Overall, URI represents both an opportunity and a risk in a dynamic market environment.