October 25, 2025 a 05:15 am
URI: Fibonacci Analysis - United Rentals, Inc.
United Rentals, Inc. has shown a robust performance in its sector, demonstrating resilience through diversified rental offerings. Recently, the stock experienced a significant upward trend, reflecting investor confidence and potential growth in infrastructure projects. This analysis will explore the recent trend, providing key insights into potential support and resistance levels using Fibonacci retracement.
Fibonacci Analysis
| Feature | Details |
|---|---|
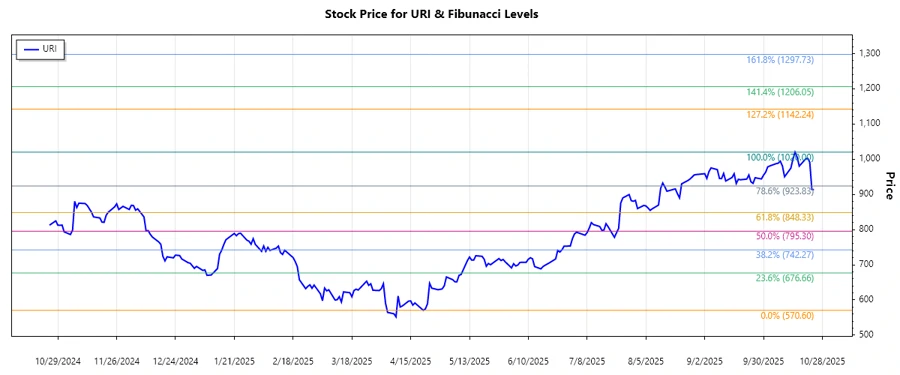
| Trend Start Date | 2025-04-22 |
| Trend End Date | 2025-10-15 |
| High Point (Price & Date) | $1020 on 15th October 2025 |
| Low Point (Price & Date) | $570.6 on 21st April 2025 |
Fibonacci Levels
| Level | Price |
|---|---|
| 0.236 | $705.54 |
| 0.382 | $774.16 |
| 0.5 | $795.3 |
| 0.618 | $816.44 |
| 0.786 | $850.74 |
The current price of $913.33 is above the 0.786 level, indicating the stock is maintaining its recent highs, and might suggest potential further upside if the technicals strengthen.
The retracement zone above indicates possible support above the 0.786 level, suggesting a strong bullish continuation unless a strong resistance emerges.
Conclusion
United Rentals, Inc. presents investors with significant opportunities, particularly in expanding its market share in the equipment rental industry. The recent bullish trend shows strong momentum, with potential resistances becoming supports at the higher Fibonacci levels. However, investors should be cautious of any negative economic indicators that could impact its sector. Continuous analysis of incoming data could reveal more about sustained growth possibilities and any abrupt trend changes.
Smart Data Insight
Master the Perfect Entry & Exit for this Stock
Don't leave your profits to chance. Historically, this stock follows specific seasonal patterns that institutional traders use to maximize returns.
- ✅ Identify the "Golden Buying Window"
- ✅ Avoid high-risk correction cycles
- ✅ Backtested data from the last 20+ years