
June 27, 2026 a 06:44 am
UPS: Fibonacci Analysis - United Parcel Service, Inc.
United Parcel Service, Inc. (UPS) has been displaying a notable trend in recent times. The company's business, largely affected by global logistics needs, shows resilience despite economic fluctuations. Analyzing the stock trends over the past months, we identify a dominant downtrend in the period reviewed. This analysis will focus on assessing the potential retracement levels and project possible support or resistance zones.
Fibonacci Analysis
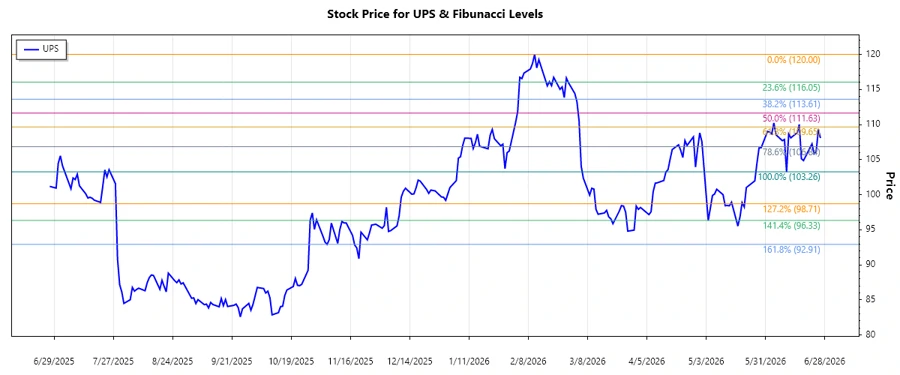
The UPS stock has experienced a clear downtrend from its high in early February 2026 to a significant low point towards the end of June 2026. This period is critical for technical analysts looking to find potential retracement levels.
| Analysis Details | Value |
|---|---|
| Trend Start Date | 2026-02-11 |
| Trend End Date | 2026-06-26 |
| High Price (Date) | $120.00 (2026-02-11) |
| Low Price (Date) | $103.26 (2026-06-10) |
Calculated Fibonacci Levels:
| Retracement Level | Price |
|---|---|
| 0.236 | $114.10 |
| 0.382 | $110.95 |
| 0.5 | $108.63 |
| 0.618 | $106.31 |
| 0.786 | $103.76 |
Currently, the UPS stock price is hovering around the 0.618 retracement level, indicating a potential area of support. Should the stock maintain above this level, a reversal to the upside might be anticipated.
This analysis suggests the current zone may act as support, offering a critical decision-making point for investors or traders considering entry or exit strategies in their investment.
Conclusion
The UPS stock has experienced significant declines, characteristic of a strong downtrend. However, it is now poised at a crucial Fibonacci retracement level which could suggest potential stabilization. Investors should weigh potential risks, such as further market downturns, against the opportunity of a recovery bounce from the support levels identified. For analysts, these Fibonacci levels serve as potential indicators of market sentiment and future price movements.
Smart Data Insight
Master the Perfect Entry & Exit for this Stock
Don't leave your profits to chance. Historically, this stock follows specific seasonal patterns that institutional traders use to maximize returns.
- ✅ Identify the "Golden Buying Window"
- ✅ Avoid high-risk correction cycles
- ✅ Backtested data from the last 20+ years