March 02, 2026 a 05:15 am
UPS: Fibonacci Analysis - United Parcel Service, Inc.
United Parcel Service (UPS) has shown a strong performance in recent months, predominantly exhibiting an upward trend. The company's vast logistics network and innovative solutions have positioned it well in the competitive transportation sector. Analyzing the specific price levels can provide insights into future price movements and potential investment opportunities.
Fibonacci Analysis
| Aspect | Details |
|---|---|
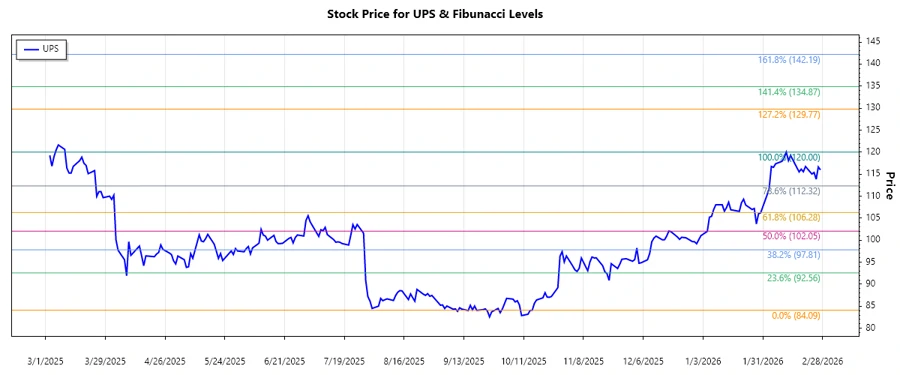
| Trend Period | 2025-10-27 to 2026-02-11 |
| High Point | $120.00 on 2026-02-11 |
| Low Point | $84.09 on 2025-10-15 |
Fibonacci Levels
| Level | Price |
|---|---|
| 0.236 | $95.75 |
| 0.382 | $101.94 |
| 0.5 | $107.04 |
| 0.618 | $112.14 |
| 0.786 | $118.16 |
The current price is in the $113 range, which places it near the 0.618 Fibonacci retracement level. This level often acts as a significant support/resistance area, suggesting that the market is considering this price for potential support.
This suggests a possible continuation of the upward trend if this level holds. Conversely, failing to maintain above this level might see the stock retreat to previous support zones.
Conclusion
United Parcel Service's stock has been on an upward trajectory, capitalizing on its extensive logistics network. The Fibonacci analysis highlights key levels that may act as future support or resistance, with the stock currently near a significant retracement level. If UPS maintains its position above the 0.618 level, this could indicate sustained bullish momentum. However, breaking below this point might suggest potential corrective movements. Investors should watch these technical levels closely as they may offer insights into emerging price dynamics. Overall, UPS presents growth potential, although market volatility demands cautious optimism.