December 14, 2025 a 10:15 am
UPS: Fibonacci Analysis - United Parcel Service, Inc.
The UPS stock price has shown a significant downtrend over the recent months. As a major player in logistics and delivery services, the stock has faced pressure due to market dynamics and competition. Understanding the technical levels through a Fibonacci analysis provides insights into potential support and resistance levels, which can guide investment decisions.
Fibonacci Analysis
| Information | Details |
|---|---|
| Start Date | 2025-01-28 |
| End Date | 2025-12-12 |
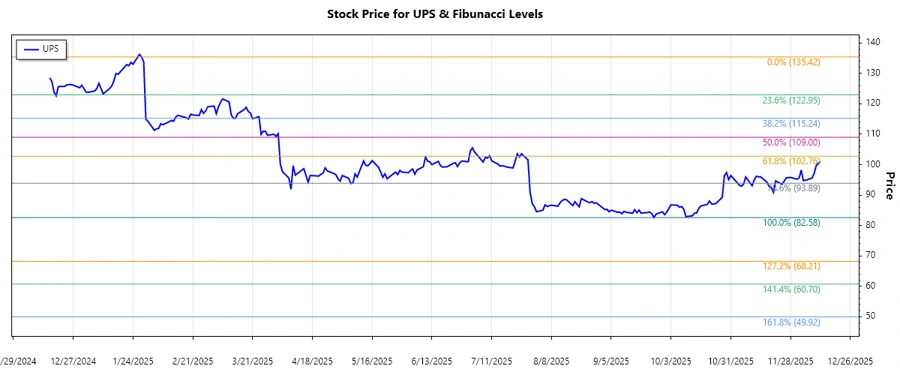
| High Point (Price) | 135.42 (2025-01-28) |
| Low Point (Price) | 82.58 (2025-10-17) |
| Fibonacci Level | Price |
|---|---|
| 0.236 | 98.07 |
| 0.382 | 104.19 |
| 0.5 | 108.99 |
| 0.618 | 113.79 |
| 0.786 | 120.51 |
Observation: The current price of 100.92 is in the 0.236 Fibonacci retracement zone, indicating a potential support level.
Technical Interpretation: The price hovering near the 0.236 level may suggest a pause or potential reversal, indicating a key support zone where demand could potentially increase.
Conclusion
The recent downtrend in UPS stock underscores a period of correction. With the current price interacting with the 0.236 Fibonacci level, there is a possibility of reaching a temporary support, providing an investment opportunity. However, continued market volatility and competitive pressures pose risks to a bullish recovery. For analysts, monitoring these levels is crucial for anticipating potential movements. Precision in analyzing technical indicators can enhance portfolio strategies, especially in volatile segments like logistics and transportation.