
April 21, 2026 a 02:46 am

UPS: Dividend Analysis - United Parcel Service, Inc.
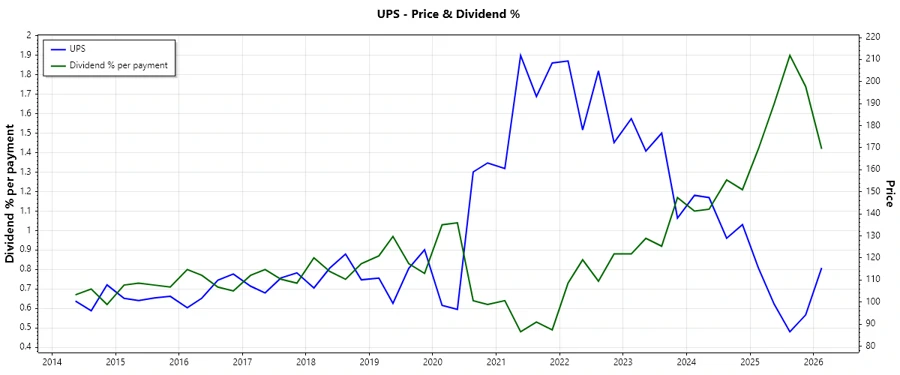
United Parcel Service, Inc. (UPS) offers a compelling dividend profile with a steady history of 28 consecutive years of dividend payouts, reflecting robust financial health and a commitment to returning value to shareholders. The company's current dividend yield stands at an impressive 5.68%, above the S&P 500 average, suggesting attractive income potential for investors. Despite the high payout ratios, UPS maintains operational resilience and capital efficiency, ensuring continued investor confidence in its dividend sustainability.
Overview 📊
UPS is positioned in the Industrials sector, demonstrating a commitment to shareholder returns through a robust dividend program. The current dividend yield is an enticing 5.68% with a dividend per share at $6.36, supported by a 28-year history of uninterrupted payments. The firm last revised its dividend downwards many years ago, showcasing its consistent payout capability.
| Attribute | Detail |
|---|---|
| Sector | Industrials |
| Dividend yield | 5.68% |
| Current dividend per share | 6.36 USD |
| Dividend history | 28 years |
| Last cut or suspension | None |
Dividend History 📈
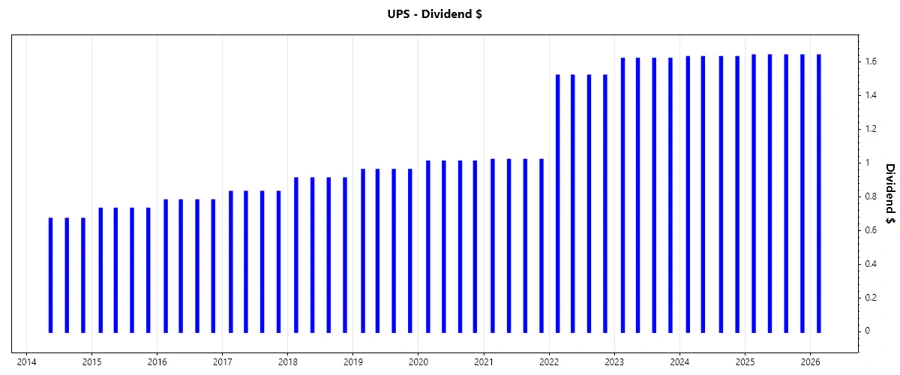
The dividend history of UPS underscores its financial strength and commitment to rewarding long-term shareholders. Such a record is vital as it instills confidence in consistent future payouts. The strategy of increasing dividends aligns with investor interests, catering to income-focused portfolios.
| Year | Dividend per Share (USD) |
|---|---|
| 2026 | 1.64 |
| 2025 | 6.56 |
| 2024 | 6.52 |
| 2023 | 6.48 |
| 2022 | 6.08 |
Dividend Growth 📈
Dividend growth is an essential indicator of the company's commitment to enhancing shareholder value. UPS's dividend growth over 3 years is 2.57% and over 5 years is 10.18%, highlighting a stable growth trajectory. This growth underpins the appeal of UPS as a viable income-generating investment while maintaining competitive returns in the long term.
| Time | Growth |
|---|---|
| 3 years | 2.57% |
| 5 years | 10.18% |
The average dividend growth is 10.18% over 5 years. This shows moderate but steady dividend growth.
Payout Ratio 📉
The payout ratio serves as a cautionary signal of how much of the company's earnings are distributed as dividends. UPS's EPS-based payout ratio is 96.88%, which reflects a high distribution relative to its earnings. Meanwhile, the free cash flow-based payout ratio stands at 113.37%, suggesting that dividends are slightly outpacing free cash flow, a point of attention for risk-aware investors.
| Key Figure | Ratio |
|---|---|
| EPS-based | 96.88% |
| Free cash flow-based | 113.37% |
These high payout ratios suggest heavy reliance on earnings and cash flow sustenance, which could signal risk in economic downturns.
Cashflow & Capital Efficiency 🗣️
Analyzing the cash flow and capital efficiency gauges UPS's ability to support its dividend payouts through internal cash flows. The evaluation focuses on metrics such as the Free Cash Flow Yield and the CAPEX to Operating Cash Flow ratio, which together indicate the company's operational efficiencies.
| Year | 2025 | 2024 | 2023 |
|---|---|---|---|
| Free Cash Flow Yield | 5.66% | 5.76% | 3.76% |
| Earnings Yield | 6.62% | 5.36% | 4.97% |
| CAPEX to Operating Cash Flow | 43.61% | 38.62% | 50.38% |
| Stock-based Compensation to Revenue | 0.08% | 0.03% | 0.24% |
| Free Cash Flow / Operating Cash Flow Ratio | 56.39% | 61.38% | 49.62% |
UPS's cash flow metrics indicate stable operations but highlight areas to monitor for potential cash constraints amid economic shifts.
Balance Sheet & Leverage Analysis 🗣️
Understanding the leverage and balance sheet provides insight into UPS's financial resilience and capability to fulfill its debt commitments while maintaining liquidity. Evaluating key ratios such as Debt-to-Equity and Current Ratios is critical in assessing leverage.
| Year | 2025 | 2024 | 2023 |
|---|---|---|---|
| Debt-to-Equity | 1.99 | 1.53 | 1.54 |
| Debt-to-Assets | 0.44 | 0.37 | 0.38 |
| Debt-to-Capital | 0.67 | 0.61 | 0.61 |
| Net Debt to EBITDA | 2.16 | 1.64 | 1.85 |
| Current Ratio | 1.22 | -- | -- |
| Quick Ratio | 1.22 | 1.12 | 1.05 |
| Financial Leverage | 4.50 | 4.19 | 4.09 |
The financial leverage ratios indicate conservative management of liabilities, yet vigilance is essential given relatively high debt-to-equity measures.
Fundamental Strength & Profitability 📈
Evaluating UPS's profitability and fundamental performance metrics helps assess the efficiency of turning resources into earnings. The focus here is on Return on Equity and Margin Analysis as key performance indicators.
| Year | 2025 | 2024 | 2023 |
|---|---|---|---|
| Return on Equity | 34.34% | 34.58% | 38.76% |
| Return on Assets | 7.62% | 8.25% | 9.47% |
| Margins (Net) | 6.29% | 6.36% | 7.39% |
| Margins (EBIT) | 9.56% | 9.13% | 10.30% |
| Margins (EBITDA) | 13.79% | 13.11% | 14.01% |
| Margins (Gross) | 18.53% | 18.77% | 19.51% |
| Research & Development to Revenue | 0% | 0% | 0% |
UPS's profitability metrics reflect robust operational efficiencies, with healthy returns on equity and solid margin profiles, albeit with slight variability in annual performance.
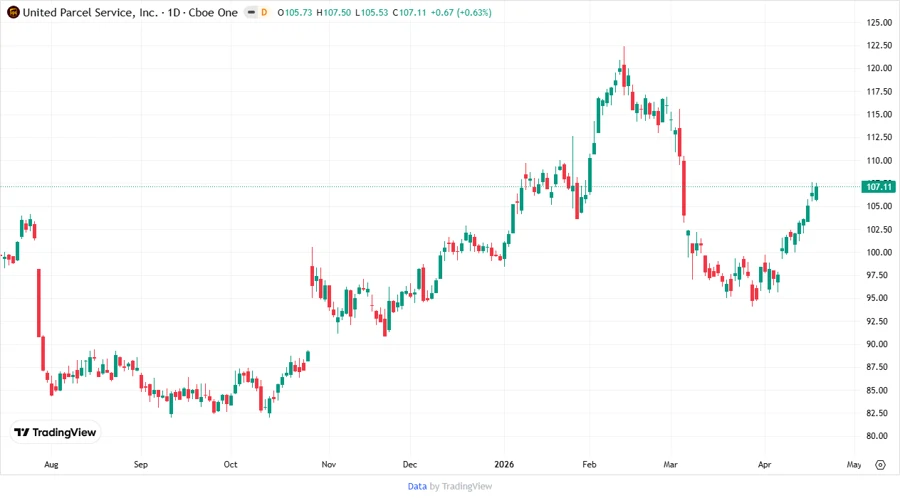
Price Development 📊
Dividend Scoring System ✅
| Category | Score | Indicator |
|---|---|---|
| Dividend yield | 4 | |
| Dividend Stability | 5 | |
| Dividend growth | 3 | |
| Payout ratio | 3 | |
| Financial stability | 4 | |
| Dividend continuity | 5 | |
| Cashflow Coverage | 3 | |
| Balance Sheet Quality | 4 |
Score: 31/40
Rating 💹
United Parcel Service, Inc. exhibits a robust dividend profile bolstered by longevity and a solid financial foundation. While the payout ratios suggest room for caution, the company's consistent operational performance supports its dividend payment commitments. Investors seeking stable, moderate income potential with some growth prospects would find UPS an attractive addition to a balanced portfolio. Maintaining vigilance for future economic impacts and internal operational adjustments remains prudent.
Smart Data Insight
Master the Perfect Entry & Exit for this Stock
Don't leave your profits to chance. Historically, this stock follows specific seasonal patterns that institutional traders use to maximize returns.
- ✅ Identify the "Golden Buying Window"
- ✅ Avoid high-risk correction cycles
- ✅ Backtested data from the last 20+ years