September 21, 2025 a 03:32 pm
UPS: Dividend Analysis - United Parcel Service, Inc.
💼 United Parcel Service (UPS) presents a robust dividend profile, exhibiting consistent growth over the past decades with a substantial yield that appeals to income-focused investors. The company's long-term commitment to dividend payments reflects financial prudence and a shareholder-friendly approach. However, high payout ratios demand attention, reflecting a balance between sustaining dividends and financial health.
Overview 📊
UPS operates in the logistics and transportation sector, a vital artery in global commerce. Its generous dividend yield of 7.57% is complemented by a dependable history of 27 years, reinforcing its standing as a reliable dividend aristocrat. The current dividend per share is 6.31 USD, with no recent cuts or suspensions, underscoring the stability of its dividend policy.
| Metric | Details |
|---|---|
| Sector | Logistics & Transportation |
| Dividend Yield | 7.57% |
| Current Dividend per Share | 6.31 USD |
| Dividend History | 27 years |
| Last Cut or Suspension | None |
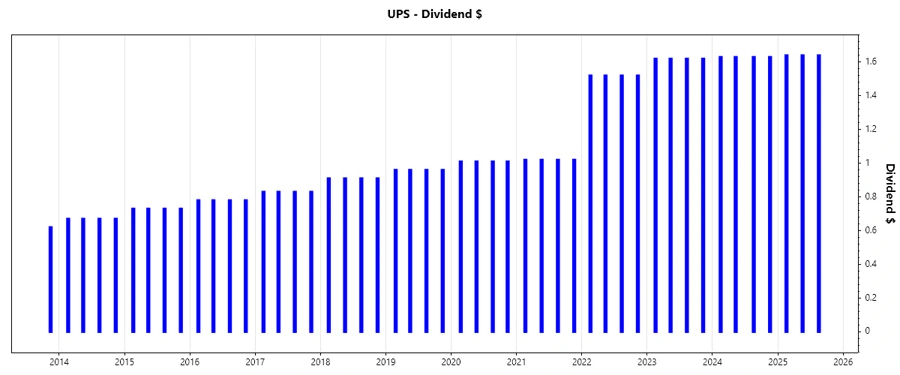
Dividend History 📈
Analyzing the historical dividend payments reveals UPS's strong commitment to providing consistent, growing returns to shareholders. Sustained increases over the years are indicative of the company's profitability and strategic reinvestment in its operations.
| Year | Dividend Per Share (USD) |
|---|---|
| 2025 | 4.92 |
| 2024 | 6.52 |
| 2023 | 6.48 |
| 2022 | 6.08 |
| 2021 | 4.08 |
Dividend Growth 📈
The dividend growth over 3 and 5 years demonstrates UPS's ability to incrementally enhance shareholder returns. Such growth is a key metric for income investors as it signifies long-term value appreciation.
| Time | Growth |
|---|---|
| 3 years | 16.91% |
| 5 years | 11.17% |
The average dividend growth is 11.17% over 5 years. This shows moderate but steady dividend growth.
Payout Ratio ⚠️
The payout ratio is a critical indicator of dividend sustainability. UPS's EPS-based payout ratio stands at 93.34%, while the FCF-based payout ratio is 151.24%, highlighting the company's aggressive dividend distribution policies. Such high ratios may pressure financial flexibility, warranting cautious monitoring.
| Key Figure | Ratio |
|---|---|
| EPS-based | 93.34% |
| Free Cash Flow-based | 151.24% |
With a payout ratio exceeding 90% on EPS and surpassing 150% on FCF, UPS exhibits a high dividend payout strategy, potentially limiting its capital reinvestment capacity.
Cashflow & Capital Efficiency 🤑
Evaluating UPS's cashflow and capital efficiency metrics offers insight into its operational profitability and strategic investment efficacy.
| Year | 2024 | 2023 | 2022 |
|---|---|---|---|
| Free Cash Flow Yield | 5.77% | 3.76% | 6.17% |
| Earnings Yield | 5.36% | 4.97% | 7.63% |
| CAPEX to Operating Cash Flow | 38.62% | 50.38% | 33.81% |
| Stock-based Compensation to Revenue | 0.03% | 0.24% | 1.57% |
| Free Cash Flow / Operating Cash Flow Ratio | 61.38% | 49.62% | 66.19% |
UPS's robust cashflow ratios reflect efficient capital management, although high CAPEX against cash flow suggests significant reinvestment to bolster future growth.
Balance Sheet & Leverage Analysis 🛡️
A thorough study of UPS's balance sheet enumerates its financial health and leverage position, crucial for understanding long-term viability.
| Year | 2024 | 2023 | 2022 |
|---|---|---|---|
| Debt-to-Equity | 1.53 | 1.54 | 1.19 |
| Debt-to-Assets | 0.37 | 0.38 | 0.33 |
| Debt-to-Capital | 0.61 | 0.61 | 0.54 |
| Net Debt to EBITDA | 1.64 | 1.85 | 0.96 |
| Current Ratio | 1.17 | 1.10 | 1.22 |
| Quick Ratio | 1.12 | 1.05 | 1.18 |
| Financial Leverage | 4.19 | 4.09 | 3.59 |
While UPS's leverage metrics align with industry norms, its debt profile suggests leverage risk, which might impact long-term growth potential amid fluctuating profit margins.
Fundamental Strength & Profitability 🔍
Key profitability ratios reflect UPS's operational success and strategic positioning in maximizing shareholder value.
| Year | 2024 | 2023 | 2022 |
|---|---|---|---|
| Return on Equity | 34.58% | 38.76% | 58.36% |
| Return on Assets | 8.25% | 9.47% | 16.24% |
| Margins: Net, EBIT, EBITDA, Gross | 6.36%, 9.13%, 13.11%, 18.77% | 7.39%, 10.30%, 14.01%, 19.51% | 11.54%, 15.51%, 18.70%, 20.07% |
| Research & Development to Revenue | 0% | 0% | 0% |
UPS exhibits substantial profitability through recurring high margins, demonstrating its efficiency and competitive disposition in the logistics sector.
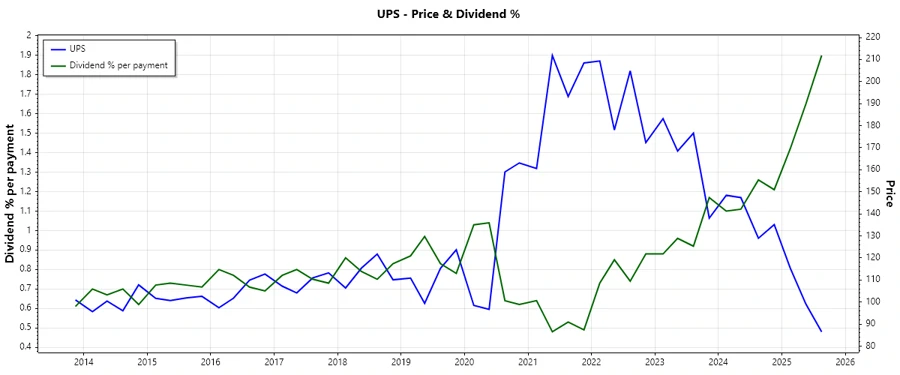
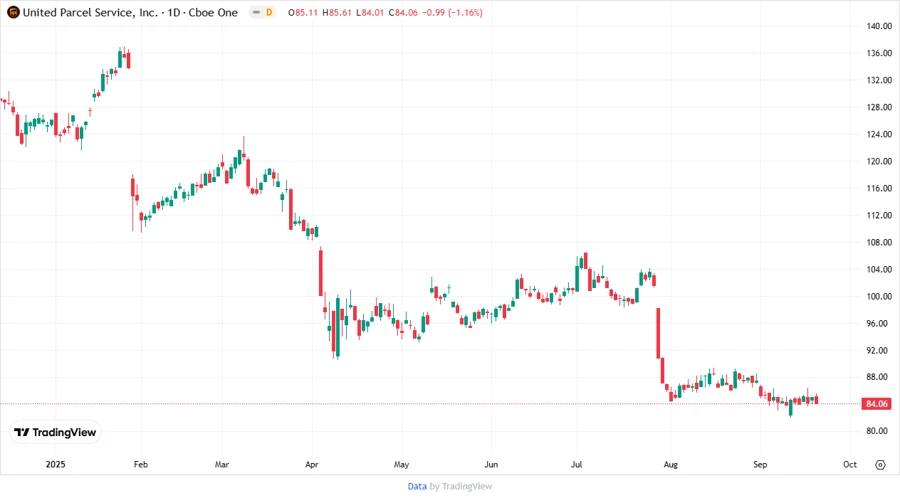
Price Development 💹
Dividend Scoring System 📏
| Criterion | Score | Up to 5 Points |
|---|---|---|
| Dividend yield | 5 | |
| Dividend Stability | 4 | |
| Dividend growth | 4 | |
| Payout ratio | 3 | |
| Financial stability | 3 | |
| Dividend continuity | 5 | |
| Cashflow Coverage | 3 | |
| Balance Sheet Quality | 3 |
Total Score: 30/40
Rating ⭐️
United Parcel Service presents an enticing dividend profile with a remarkable yield and extensive history. Despite ambitious payout ratios that may challenge its reinvestment capabilities, the company's strategic financial planning and industry standing provide confidence in sustained shareholder returns. UPS is a compelling option for income investors willing to navigate leverage considerations.