May 23, 2026 a 03:15 pm
UNP: Fibonacci Analysis - Union Pacific Corporation
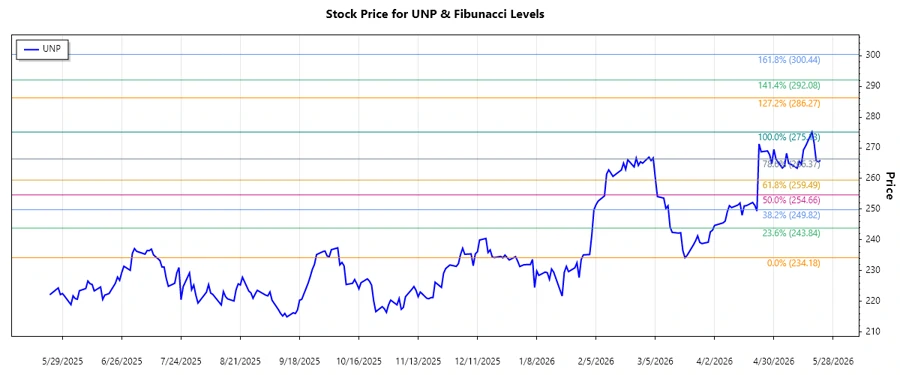
The stock of Union Pacific Corporation (UNP) has shown a resilient uptrend over the past months. The company, with its extensive rail network, continues to be a key player in the transport sector, delivering essential products across the U.S. Given the trend data, investors need to consider the potential for continued growth, underscored by market demand and economic recovery indicators. A critical point for investors is the price level at Fibonacci retracement zones, which could indicate potential support or resistance levels.
Fibonacci Analysis
| Detail | Value |
|---|---|
| Trend Start Date | 2026-03-19 |
| Trend End Date | 2026-05-22 |
| High Price | $275.13 (2026-05-18) |
| Low Price | $234.18 (2026-03-19) |
| Fibonacci Levels |
|
| Current Price | $265.88 |
| Retracement Zone | 0.618 |
| Technical Interpretation | The current price is near the 0.618 retracement level, which often acts as a significant support in a bullish market. It suggests a potential rebound if the price holds, signaling continued upward momentum. |
Conclusion
The stock of Union Pacific Corporation reflects a strong upward trajectory, enhanced by the company's strategic operations in the transportation sector. The presence of the stock price in the 0.618 Fibonacci retracement zone indicates a strong support level, suggesting possible further gains. However, risks include economic downturns or regulatory changes affecting the rail industry. Analysts should monitor these indicators closely to gauge the sustainability of the trend. Continued observation of market dynamics and specific levels, as outlined in our analysis, will be crucial for making informed investment decisions.
Smart Data Insight
Master the Perfect Entry & Exit for this Stock
Don't leave your profits to chance. Historically, this stock follows specific seasonal patterns that institutional traders use to maximize returns.
- ✅ Identify the "Golden Buying Window"
- ✅ Avoid high-risk correction cycles
- ✅ Backtested data from the last 20+ years