December 09, 2025 a 05:15 am
UNP: Fibunacci Analysis - Union Pacific Corporation
Union Pacific Corporation, a prominent player in the railroad industry, has shown a steady performance in recent months. An illustration of the company's adaptability and strength, the stock has navigated through diverse market conditions effectively. Investors can explore this stock for its stability in their portfolio. The analysis here delves into its recent price trends using technical indicators.
Fibonacci Analysis
| Analysis Aspect | Details | ||||||||||||
|---|---|---|---|---|---|---|---|---|---|---|---|---|---|
| Trend Start Date | 2025-09-16 | ||||||||||||
| Trend End Date | 2025-12-04 | ||||||||||||
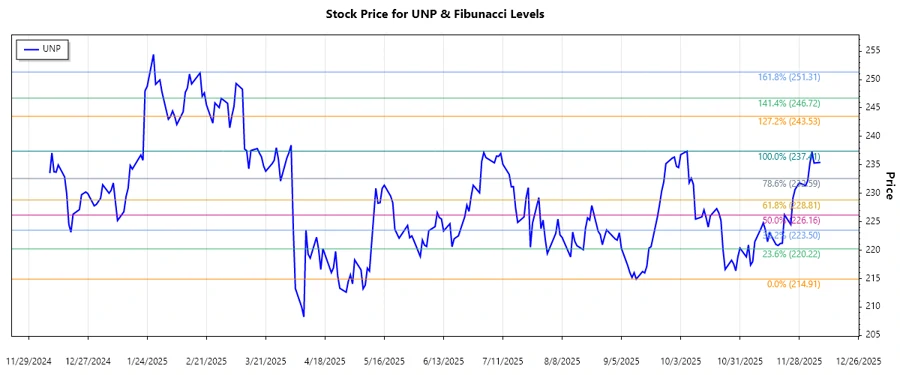
| Highest Price Point | $237.41 on 2025-10-06 | ||||||||||||
| Lowest Price Point | $214.91 on 2025-09-12 | ||||||||||||
| Fibonacci Levels |
|
||||||||||||
| Current Price Level | $235.44 on 2025-12-08 | ||||||||||||
| Retracement Zone | 0.786 | ||||||||||||
| Technical Interpretation | The current price is within the 0.786 Fibonacci retracement level, suggesting a potential strong resistance zone near this level. |
Conclusion
Union Pacific's stock is currently navigating within significant Fibonacci levels, suggesting potential resistance near the 0.786 level. This signals that investors should be cautious of possible price pullbacks. However, the resilience shown by UNP in hitting upper fibonacci levels amidst market fluctuations provides an aspect of optimism. Technical analysts would note that surpassing these resistances could signal further upward momentum. While risks of retracements exist, Union Pacific remains a diligent stock to watch for upscale movements.