October 02, 2025 a 04:45 pm
UNP: Fibonacci Analysis - Union Pacific Corporation
Union Pacific Corporation's stock has exhibited significant volatility yet remains a staple in the transportation sector. Recent trends demonstrate fluctuations influenced by market demand and macroeconomic factors. As a critical player in the railroad business, its performance is indicative of broad industrial health, making its analysis pertinent for strategic investment decisions.
Fibonacci Analysis
| Start Date | End Date | High Price | Low Price |
|---|---|---|---|
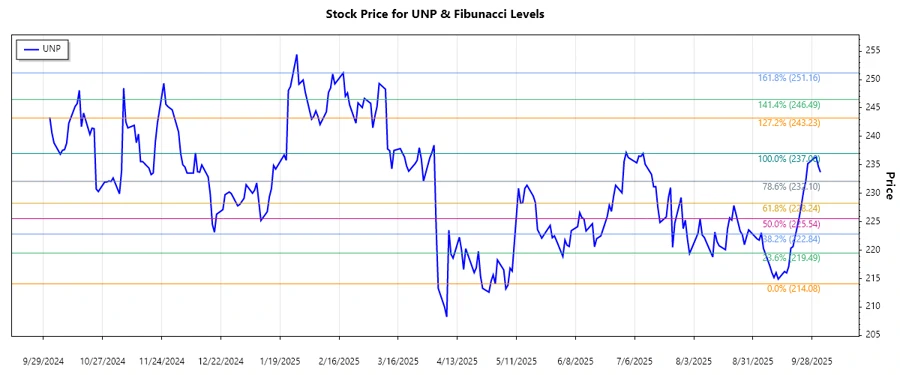
| 2025-07-14 | 2025-10-02 | $237.00 (2025-07-10) | $214.08 (2025-09-12) |
| Fibonacci Level | Price Level |
|---|---|
| 0.236 | $219.84 |
| 0.382 | $223.73 |
| 0.5 | $226.54 |
| 0.618 | $229.34 |
| 0.786 | $233.14 |
Current market activity suggests the price is within the 0.618 retracement zone. Technically, this level could act as a support, potentially leading to a rebound or continuation pattern considering the existing market sentiment.
Conclusion
Union Pacific Corporation remains a pivotal force within the railroad sector, navigating through economic headwinds and industry demand fluctuations. Its recent price trends reflect a mix of resilience and market adjustment, common within the transportation infrastructure segment. Divergence from mid-level Fibonacci retracement zones could signal pivotal movement opportunities, suggesting potential investor gains. Nonetheless, understanding macroeconomic impacts is crucial for comprehensive risk assessments as external pressures could influence future growth trajectories.
Smart Data Insight
Master the Perfect Entry & Exit for this Stock
Don't leave your profits to chance. Historically, this stock follows specific seasonal patterns that institutional traders use to maximize returns.
- ✅ Identify the "Golden Buying Window"
- ✅ Avoid high-risk correction cycles
- ✅ Backtested data from the last 20+ years