May 28, 2025 a 03:15 pm

UNP: Fibonacci Analysis - Union Pacific Corporation
The Union Pacific Corporation (UNP) stock has recently shown a noteworthy trend based on the historic data analysis. The company's expansive rail network and diverse service offerings make it a significant player in the railroad industry, providing critical transportation services across various sectors. Recent market movements illustrate the potential for both growth and retracement, making it an interesting analysis candidate for investors looking at the technical aspects of the stock.
Fibonacci Analysis
The latest trend analysis of Union Pacific Corporation's stock shows a dominant **downtrend**. The key Fibonacci levels calculated based on this trend offer insights into potential support and resistance levels. Let's explore these levels in the context of the stock's price movements.
| Parameter | Value |
|---|---|
| Trend Start Date | 2025-03-10 |
| Trend End Date | 2025-05-28 |
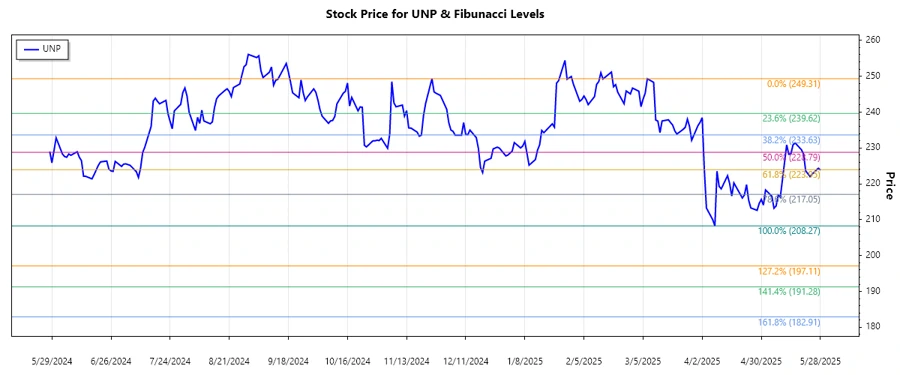
| High Point Price | $249.31 (2025-03-07) |
| Low Point Price | $208.27 (2025-04-08) |
Fibonacci Retracement Levels
| Level | Price |
|---|---|
| 0.236 | $218.68 |
| 0.382 | $225.13 |
| 0.5 | $228.79 |
| 0.618 | $232.45 |
| 0.786 | $237.63 |
The current price is $223.84, which places it in the 0.382 retracement zone, suggesting a potential resistance level. Given this technical setup, a sustained breakout above the 0.382 level could indicate bullish momentum, whereas a failure to breach might mean continued downside risk.
Conclusion
Union Pacific Corporation (UNP) remains a resilient stock within the railroad sector, presenting both opportunities and challenges for investors. The current downtrend, highlighted within our analysis, positions the stock at a critical juncture at the 0.382 retracement level. A breakthrough might hint at bullish potential, leading to a more optimistic outlook. However, continuous monitoring is necessary as failure to surpass the identified resistance could result in further bearish sentiment. Analysts should consider these technical indicators while keeping an eye on broader market and industry-specific developments.