
July 04, 2026 a 07:31 am


UNP: Dividend Analysis - Union Pacific Corporation
Union Pacific Corporation presents a robust dividend profile with a steady track record. With a history of continuous dividend payments spanning 47 years, the company illustrates stability and reliability in its dividend policy. The moderate dividend yield of 2.10% signals a balance between income and growth potential, while its admirable dividend growth rate over 5 years signifies a healthy financial posture.
📊 Overview
As a key player in the transportation and logistics sector, Union Pacific Corporation has cultivated a strong dividend-paying tradition. The company boasts a dividend yield of 2.10%, driven by a current dividend per share of 5.46 USD. Impressively, Union Pacific has upheld a 47-year history of dividend consistency without recent cuts or suspensions, demonstrating its commitment to returning value to shareholders.
| Metric | Value |
|---|---|
| Sector | Transportation and Logistics |
| Dividend Yield | 2.10% |
| Current Dividend Per Share | 5.46 USD |
| Dividend History | 47 years |
| Last Cut or Suspension | None |
📈 Dividend History
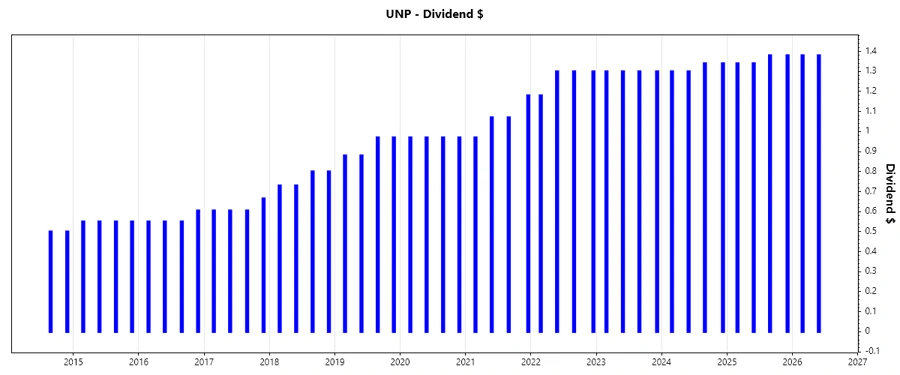
Union Pacific Corporation’s longstanding commitment to dividend payments is a testament to its operational success and cash flow generation capabilities. This consistency significantly enhances investor confidence and serves as a reliable income source. Below is the depiction of the last five dividend payments corroborating Union Pacific's financial strength.
| Year | Dividend Per Share |
|---|---|
| 2026 | 2.76 USD |
| 2025 | 5.44 USD |
| 2024 | 5.28 USD |
| 2023 | 5.20 USD |
| 2022 | 5.08 USD |
📊 Dividend Growth
The ability of Union Pacific Corporation to progressively increase its dividends is an indicator of the company’s growth and financial soundness. A detailed review of the compound annual growth rate (CAGR) over the past few years reveals a positive trajectory in its dividend policy.
| Time | Growth |
|---|---|
| 3 years | 2.31% |
| 5 years | 6.99% |
The average dividend growth is 6.99% over 5 years. This shows moderate but steady dividend growth, reflecting Union Pacific Corporation's strong financial management and commitment to increasing shareholder value.
🗣️ Payout Ratio
The payout ratio is a critical indicator of a company's ability to sustain its dividend payments. Union Pacific Corporation's payout ratios are well within industry standards, showcasing its capacity to distribute a portion of earnings without compromising reinvestment needs.
| Key Figure | Ratio |
|---|---|
| EPS-based | 44.90% |
| Free Cash Flow-based | 56.91% |
The EPS-based payout ratio of 44.90% and FCF-based ratio of 56.91% highlight a balanced approach in managing cash flows. Union Pacific maintains sustainable distribution levels while retaining capital for growth initiatives.
📊 Cashflow & Capital Efficiency
Examining the cash flow and capital efficiency metrics provides insight into Union Pacific's operational efficacy and strategic capital allocation. These factors are integral to understanding the sustainability of dividend policies and overall financial health.
| Year | 2025 | 2024 | 2023 |
|---|---|---|---|
| Free Cash Flow Yield | 4.01% | 4.25% | 3.19% |
| Earnings Yield | 5.21% | 4.87% | 4.26% |
| CAPEX to Operating Cash Flow | 40.15% | 36.94% | 43.04% |
| Stock-based Compensation to Revenue | 0% | 0% | 0% |
| Free Cash Flow / Operating Cash Flow Ratio | 59.19% | 63.06% | 56.96% |
The analysis reveals a consistent strategy in balancing cash flows with strategic investments, ensuring that operational demands and shareholder returns operate in tandem.
🗣️ Balance Sheet & Leverage Analysis
Union Pacific Corporation’s leverage metrics depict its fiscal prudence and strategic debt management. An analysis of these metrics provides insights into its ability to manage leverage while sustaining financial stability.
| Year | 2025 | 2024 | 2023 |
|---|---|---|---|
| Debt-to-Equity | 1.72 | 1.92 | 2.31 |
| Debt-to-Assets | 45.65% | 47.94% | 50.91% |
| Debt-to-Capital | 63.27% | 65.78% | 69.80% |
| Net Debt to EBITDA | 2.36 | 2.52 | 2.78 |
| Current Ratio | 0.91 | 0.77 | 0.81 |
| Quick Ratio | 0.75 | 0.62 | 0.67 |
| Financial Leverage | 3.77 | 4.01 | 4.54 |
Although Union Pacific Corporation's leverage ratios reflect moderate dependency on debt, their strong financial leverage and robust quick and current ratios underscore their ability to meet short-term obligations efficiently.
📊 Fundamental Strength & Profitability
Key metrics such as Return on Equity (ROE) and margins offer insights into Union Pacific Corporation's operational effectiveness and profitability. Solid returns and operational margins are indicative of sound management practices and competitive standing within the industry.
| Year | 2025 | 2024 | 2023 |
|---|---|---|---|
| Return on Equity | 38.65% | 39.95% | 43.14% |
| Return on Assets | 10.24% | 9.96% | 9.50% |
| Net Margin | 29.12% | 27.82% | 26.45% |
| EBIT Margin | 42.74% | 41.50% | 39.69% |
| EBITDA Margin | 52.82% | 51.54% | 49.45% |
| Gross Margin | 59.38% | 45.52% | 43.65% |
| Research & Development to Revenue | 0% | 0% | 0% |
Union Pacific demonstrates strong profitability through high returns on equity and assets. The stable margins indicate effective cost management and competitive advantage in the sector.
📈 Price Development
📊 Dividend Scoring System
| Criterion | Score | Scale |
|---|---|---|
| Dividend Yield | 3 | |
| Dividend Stability | 5 | |
| Dividend Growth | 4 | |
| Payout Ratio | 4 | |
| Financial Stability | 4 | |
| Dividend Continuity | 5 | |
| Cashflow Coverage | 4 | |
| Balance Sheet Quality | 3 |
Total Score: 32/40
🗣️ Rating
Union Pacific Corporation's dividend profile emerges as robust with a score of 32 out of 40. The company excels in dividend stability and continuity, reflecting a commitment to shareholder returns. Moderate yield alongside solid financial underpinnings suggests a favorable outlook, though some potential for improvement remains, particularly in yield maximization and balance sheet optimization. Overall, Union Pacific is a commendable choice for dividend-seeking investors prioritizing reliability and growth.
Smart Data Insight
Master the Perfect Entry & Exit for this Stock
Don't leave your profits to chance. Historically, this stock follows specific seasonal patterns that institutional traders use to maximize returns.
- ✅ Identify the "Golden Buying Window"
- ✅ Avoid high-risk correction cycles
- ✅ Backtested data from the last 20+ years