February 24, 2026 a 12:46 pm


UNP: Dividend Analysis - Union Pacific Corporation
Union Pacific Corporation, a titan in the freight transport industry, boasts a robust dividend track record. With a history stretching over 47 years without any recent suspensions, it presents a reliable investment avenue for dividend-focused investors. The corporation exhibits a moderate dividend yield with consistent growth, underpinned by stable free cash flow and earnings.
📊 Overview
Union Pacific Corporation operates within the Transportation sector, renowned for its essential role in freight movement across North America. The company's financial metrics portray a solid foundation, highlighting its resilience within the sector.
| Metric | Value |
|---|---|
| Sector | Transportation |
| Dividend Yield | 2.08% |
| Current Dividend Per Share | 5.46 USD |
| Dividend History | 47 years |
| Last Cut or Suspension | None |
🗣️ Dividend History
Union Pacific has displayed formidable dividend discipline, maintaining a steady payout across decades. With a rich history spanning 47 years, investors can have confidence in their long-term dividend plans. Such consistent dividend performance enhances investor trust and indicates financial resiliency.
| Year | Dividend Per Share (USD) |
|---|---|
| 2026 | 1.38 |
| 2025 | 5.44 |
| 2024 | 5.28 |
| 2023 | 5.20 |
| 2022 | 5.08 |
📈 Dividend Growth
The growth aspect of Union Pacific's dividend strategy showcases its commitment to expanding shareholder returns. Over the recent years, the dividends have grown at a reasonable pace, a reflection of profitability and effective capital management.
| Time | Growth |
|---|---|
| 3 years | 2.31% |
| 5 years | 6.99% |
The average dividend growth is 6.99% over 5 years. This shows moderate but steady dividend growth.
⚖️ Payout Ratio
Payout ratios are crucial to understanding how much of the earnings or free cash flow is distributed as dividends. A balanced payout ratio implies that the company can sustain its dividends without compromising future growth or increasing leverage.
| Key Figure | Ratio |
|---|---|
| EPS-based | 45.33% |
| Free Cash Flow-based | 58.94% |
A payout ratio of 45.33% based on EPS and 58.94% based on FCF indicates a balanced distribution strategy, leaving room for reinvestment and growth.
💰 Cashflow & Capital Efficiency
Evaluating cash flow and capital efficiency provides insights into operational effectiveness and financial flexibility. Metrics such as Free Cash Flow Yield and Earnings Yield are vital for assessing cash generation capacity relative to value.
| Year | 2025 | 2024 | 2023 |
|---|---|---|---|
| Free Cash Flow Yield | 4.01% | 4.25% | 3.19% |
| Earnings Yield | 5.21% | 4.87% | 4.26% |
| CAPEX to Operating Cash Flow | 40.81% | 36.94% | 43.04% |
| Stock-based Compensation to Revenue | 0.00% | 0.00% | 0.00% |
| Free Cash Flow / Operating Cash Flow Ratio | 59.19% | 63.06% | 56.96% |
The cash flow stability and capital efficiency indicate sound operational management, with significant capacity to cover operational needs and invest in growth opportunities.
🔍 Balance Sheet & Leverage Analysis
A healthy balance sheet is pivotal for financial stability, especially in market volatilities. Key metrics such as Debt-to-Equity and Current Ratio offer a view on leverage and liquidity.
| Year | 2025 | 2024 | 2023 |
|---|---|---|---|
| Debt-to-Equity | 1.72 | 1.92 | 2.31 |
| Debt-to-Assets | 0.46 | 0.48 | 0.51 |
| Debt-to-Capital | 0.63 | 0.66 | 0.70 |
| Net Debt to EBITDA | 2.36 | 2.52 | 2.78 |
| Current Ratio | 0.91 | 0.77 | 0.81 |
| Quick Ratio | 0.75 | 0.62 | 0.67 |
| Financial Leverage | 3.77 | 4.01 | 4.54 |
The leverage analysis shows a relatively high level of debt, indicating a reliance on leverage for expansion, possibly increasing financial risk exposure.
📈 Fundamental Strength & Profitability
The evaluation of fundamental strength and profitability is essential to gauge operational efficiency and competitive positioning. Key profitability margins such as ROE and ROA measure the company's efficiency in generating profits relative to shareholders' equity and assets.
| Year | 2025 | 2024 | 2023 |
|---|---|---|---|
| Return on Equity (ROE) | 38.65% | 39.95% | 43.14% |
| Return on Assets (ROA) | 10.24% | 9.96% | 9.50% |
| Net Profit Margin | 29.12% | 27.82% | 26.45% |
| EBIT Margin | 42.74% | 41.50% | 39.69% |
| EBITDA Margin | 52.82% | 51.54% | 49.45% |
| Gross Margin | 59.38% | 45.52% | 43.65% |
| Research & Development to Revenue | 0.00% | 0.00% | 0.00% |
With a strong ROE and healthy profit margins, Union Pacific corporation demonstrates significant profitability and operational efficiency, albeit with no expenditure on R&D.
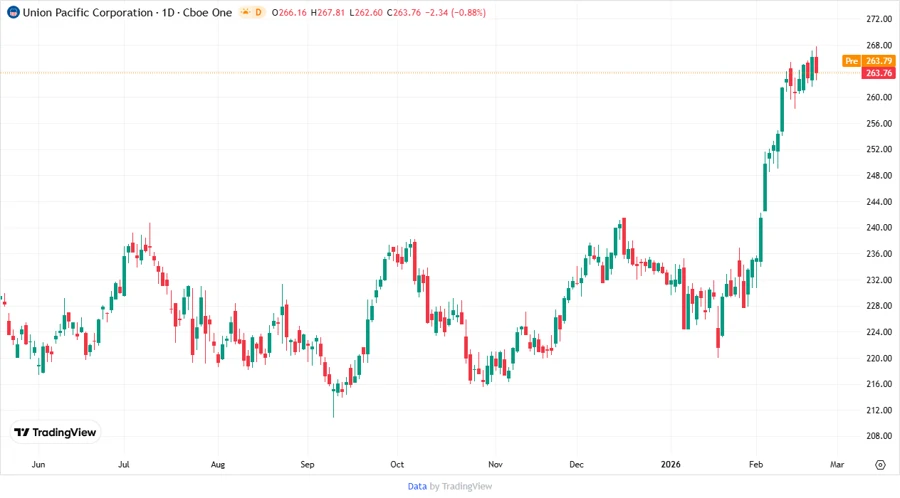
📉 Price Development
✅ Dividend Scoring System
| Criteria | Score | Indicator |
|---|---|---|
| Dividend Yield | 3 | |
| Dividend Stability | 5 | |
| Dividend Growth | 4 | |
| Payout Ratio | 4 | |
| Financial Stability | 3 | |
| Dividend Continuity | 5 | |
| Cashflow Coverage | 4 | |
| Balance Sheet Quality | 3 |
Total Score: 31/40
🔍 Rating
Union Pacific Corporation emerges as a compelling choice for dividend investors. With its secure dividend payments, consistent growth, and operational efficiency, it offers a valuable return for investors interested in stable income generation. While its reliance on leverage calls for cautious monitoring, the firm's overall performance and significant market position endorse a favorable investment outlook.