January 18, 2026 a 03:31 pm

UNP: Dividend Analysis - Union Pacific Corporation
Union Pacific Corporation, a leader in the transportation and logistics sector, demonstrates a strong dividend profile backed by substantial market capitalization. With a long-standing history of consistent dividend payments spanning several decades, the company provides reliable returns to its shareholders. Despite the competitive industry landscape, Union Pacific continues to uphold its fiscal responsibilities, as reflected by its steady dividend growth and commitment to shareholder value.
📊 Overview
Union Pacific Corporation operates in the transportation sector, providing essential rail services across North America. The corporation boasts a commendable dividend yield of 2.31%, which, although modest, is supported by a current dividend per share of 5.29 USD. With an impressive 46-year history of dividend payments, Union Pacific has not experienced any dividend cuts or suspensions since 1998, underscoring its financial stability.
| Metric | Value |
|---|---|
| Sector | Transportation |
| Dividend Yield | 2.31% |
| Current Dividend per Share | 5.29 USD |
| Dividend History | 46 years |
| Last Cut or Suspension | 1998 |
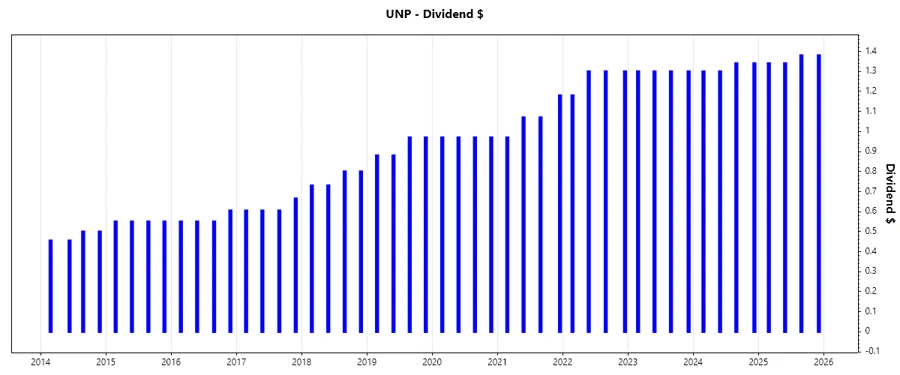
📜 Dividend History
The long and reliable dividend history of Union Pacific is a testament to its enduring profitability and efficiency. This track record provides confidence to investors looking for consistent income streams. Below is the recent dividend payment history:
| Year | Dividend per Share (USD) |
|---|---|
| 2025 | 5.44 |
| 2024 | 5.28 |
| 2023 | 5.20 |
| 2022 | 5.08 |
| 2021 | 4.29 |
📈 Dividend Growth
Dividend growth is a critical indicator of a company's future dividend potential and sustainability. Union Pacific has shown a 3-year dividend growth of 2.31% and a 5-year growth of 6.99%, indicating a steadily increasing payout, which is attractive for dividend-focused investors.
| Time | Growth |
|---|---|
| 3 years | 2.31% |
| 5 years | 6.99% |
The average dividend growth is 6.99% over 5 years. This shows moderate but steady dividend growth.
💹 Payout Ratio
The payout ratio determines the sustainability of a company's dividend payments. With an EPS-based payout ratio of 44.42% and an FCF-based ratio of 52.16%, Union Pacific is effectively balancing shareholder returns with reinvestment opportunities to maintain growth and stability.
| Key figure | Ratio |
|---|---|
| EPS-based | 44.42% |
| Free cash flow-based | 52.16% |
A payout ratio below 50% suggests prudent financial management, indicating both sufficiency in covering dividends and room for growth in business operations.
💰 Cashflow & Capital Efficiency
Understanding cash flow dynamics and capital efficiency provides insights into a company's operational health and future potential. Here's a breakdown:
| Metric | 2024 | 2023 | 2022 |
|---|---|---|---|
| Free Cash Flow Yield | 4.25% | 3.19% | 4.45% |
| Earnings Yield | 4.87% | 4.26% | 5.43% |
| CAPEX to Operating Cash Flow | 36.94% | 43.04% | 38.67% |
| Stock-based Compensation to Revenue | 0% | 0% | 0.40% |
| Free Cash Flow / Operating Cash Flow Ratio | 0.63 | 0.57 | 0.61 |
Union Pacific's capital efficiency and cash flow ratios display a strong alignment with their operational capabilities, emphasizing efficient asset utilization and cash generation.
⚖️ Balance Sheet & Leverage Analysis
Leverage and balance sheet insights reveal the firm's capacity to manage debt and financial obligations, ensuring operational and financial health.
| Metric | 2024 | 2023 | 2022 |
|---|---|---|---|
| Debt-to-Equity | 1.92 | 2.31 | 2.87 |
| Debt-to-Assets | 0.48 | 0.51 | 0.53 |
| Debt-to-Capital | 0.65 | 0.70 | 0.74 |
| Net Debt to EBITDA | 2.52 | 2.78 | 2.69 |
| Current Ratio | 0.75 | 0.81 | 0.71 |
| Quick Ratio | 0.62 | 0.67 | 0.58 |
Despite a leverage history that shows a gradual increase, Union Pacific's balance sheet metrics suggest resilient financial stability and prudent debt management, which align with its growth trajectories.
🏛️ Fundamental Strength & Profitability
Profitability metrics indicate a company's ability to generate income relative to revenue, illustrating efficiency and market positioning.
| Metric | 2024 | 2023 | 2022 |
|---|---|---|---|
| Return on Equity | 39.95% | 43.14% | 57.54% |
| Return on Assets | 9.96% | 9.50% | 10.69% |
| Margins: Net | 27.82% | 26.45% | 28.13% |
| Margins: EBIT | 41.50% | 39.69% | 41.58% |
| Margins: EBITDA | 51.54% | 49.45% | 50.80% |
Union Pacific's robust profitability indicators highlight its capability to leverage operational efficiencies, sustained by its strategic positioning in a dynamic industry environment.
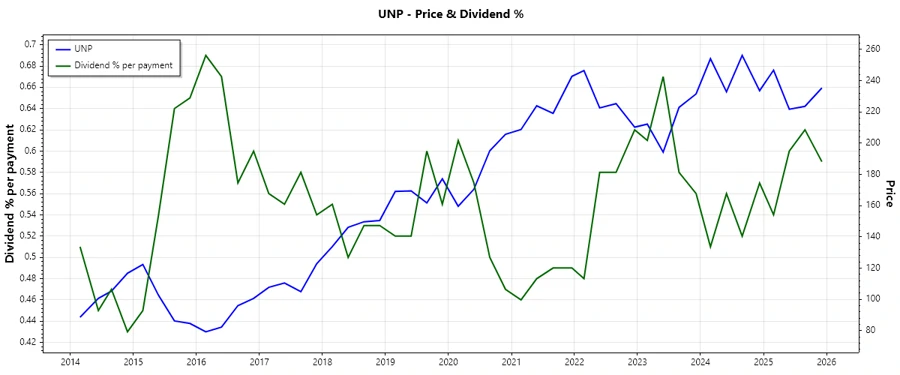
📈 Price Development
✅ Dividend Scoring System
| Category | Score | Score Bar |
|---|---|---|
| Dividend yield | 3 | |
| Dividend Stability | 5 | |
| Dividend growth | 4 | |
| Payout ratio | 4 | |
| Financial stability | 4 | |
| Dividend continuity | 5 | |
| Cashflow Coverage | 4 | |
| Balance Sheet Quality | 4 |
Total Score: 33/40
🗣️ Rating
Union Pacific Corporation stands out as a fiscally stable entity with a robust dividend policy and consistent growth, which positions it as an attractive option for income-focused investors. The company’s long dividend history, coupled with its moderate payout ratios and growth-oriented strategies, makes it a compelling choice for those prioritizing reliable income streams in the transportation sector.