December 08, 2025 a 12:46 pm


UNP: Dividend Analysis - Union Pacific Corporation
📊 Union Pacific Corporation boasts a strong dividend profile, offering both stability and moderate growth. With a dividend yield of 2.31% and an impressive history of 46 years without a cut since 1998, it holds a reliable status in the market. However, a cautious assessment of its payout ratios and leverage is advisable.
Overview
UNP stands as a prominent entity within its sector, demonstrating substantial dividend yield and a remarkably established dividend history. Let's delve into the specifics:
| Metric | Detail |
|---|---|
| Sector | Transportation |
| Dividend yield | 2.31% |
| Current dividend per share | 5.29 USD |
| Dividend history | 46 years |
| Last cut or suspension | 1998 |
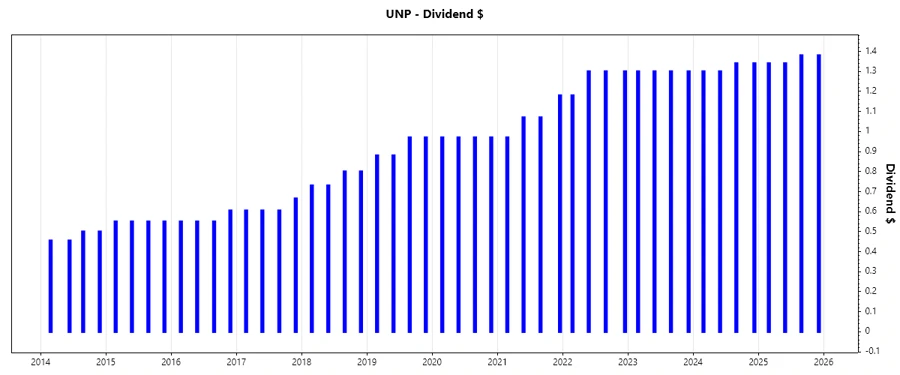
Dividend History
The consistency in dividend payment over the past 46 years accentuates UNP's commitment to shareholders. This track record not only speaks to its resilience but also enhances investor confidence.
| Year | Dividend per Share (USD) |
|---|---|
| 2025 | 5.44 |
| 2024 | 5.28 |
| 2023 | 5.20 |
| 2022 | 5.08 |
| 2021 | 4.29 |
Dividend Growth
UNP's dividend growth rates over the recent years show a reassuring upward trend, significant for gauging future income potential for long-term investors.
| Time | Growth |
|---|---|
| 3 years | 7.17% |
| 5 years | 7.37% |
The average dividend growth is 7.37% over 5 years. This indicates moderate but steady dividend growth.
Payout Ratio
Examining both EPS and FCF-based payout ratios provides profound insight into the sustainability of UNP's dividends. A balanced ratio is essential for long-term dividend viability.
| Key Figure | Ratio |
|---|---|
| EPS-based | 44.42% |
| Free cash flow-based | 52.16% |
With an EPS-based payout ratio of 44.42% and FCF-based ratio of 52.16%, UNP maintains a conservative distribution strategy ensuring dividend sustainability while allowing room for capital reinvestment.
Cashflow & Capital Efficiency
The correlation between cash flow generation and its utilization reflects the robustness and sustainability of the company's operations as well as its capacity for capital reinvestment.
| Metric | 2024 | 2023 | 2022 |
|---|---|---|---|
| Free Cash Flow Yield | 4.25% | 3.19% | 4.45% |
| Earnings Yield | 4.87% | 4.36% | 5.43% |
| CAPEX to Operating Cash Flow | 36.94% | 43.04% | 38.67% |
| Stock-based Compensation to Revenue | 0% | 0% | 0.40% |
| Free Cash Flow / Operating Cash Flow Ratio | 63.06% | 56.96% | 61.33% |
UNP's cash flow metrics indicate good balance sheet health, with healthy free cash flow yields further fortifying its capital reinvestment potential and taking advantage of attractive investment opportunities.
Balance Sheet & Leverage Analysis
Assessing the debt structure and liquidity metrics gives a clear picture of the company's ability to meet its long-term obligations while maintaining operational flexibility.
| Metric | 2024 | 2023 | 2022 |
|---|---|---|---|
| Debt-to-Equity | 1.92 | 2.31 | 2.87 |
| Debt-to-Assets | 0.48 | 0.51 | 0.53 |
| Debt-to-Capital | 0.66 | 0.70 | 0.74 |
| Net Debt to EBITDA | 2.52 | 2.78 | 2.69 |
| Current Ratio | 0.75 | 0.81 | 0.72 |
| Quick Ratio | 0.62 | 0.67 | 0.58 |
| Financial Leverage | 4.01 | 4.54 | 5.38 |
Despite its relatively high leverage ratio, the company's ability to cover interest payments and maintain adequate liquidity suggests resilience in meeting its financial commitments.
Fundamental Strength & Profitability
These ratios reflect the firm’s efficiency in managing its resources to maximize shareholder value and maintain competitive positioning in the market.
| Metric | 2024 | 2023 | 2022 |
|---|---|---|---|
| Return on Equity | 0.40 | 0.43 | 0.58 |
| Return on Assets | 0.10 | 0.10 | 0.11 |
| Net Margin | 27.82% | 26.45% | 28.13% |
| EBIT Margin | 41.50% | 39.69% | 41.58% |
| EBITDA Margin | 51.54% | 49.45% | 50.80% |
| Gross Margin | 45.52% | 43.65% | 45.04% |
| Research & Development to Revenue | 0% | 0% | 0.40% |
UNP's robust profitability metrics underscore its effective cost control measures and strategic revenue enhancements, thereby boosting investor trust and potential returns.
Price Development
Dividend Scoring System
| Category | Score | Performance |
|---|---|---|
| Dividend yield | 3 | |
| Dividend Stability | 5 | |
| Dividend growth | 4 | |
| Payout ratio | 4 | |
| Financial stability | 3 | |
| Dividend continuity | 5 | |
| Cashflow Coverage | 4 | |
| Balance Sheet Quality | 3 |
Total Score: 31/40
Rating
✅ Union Pacific Corporation exemplifies a well-rounded dividend growth stock, meriting consideration for investors seeking a mix of stability and modest growth in their portfolios. Its consistent dividend history and ability to manage financial obligations suggest it remains a compelling choice in today's economic landscape.