August 26, 2025 a 12:47 pm


UNP: Dividend Analysis - Union Pacific Corporation
Union Pacific Corporation's dividend strategy exhibits a balance of consistent growth and shareholder rewards. With a dividend history spanning over 46 years, the company has demonstrated a steadfast commitment to investor returns, appealing to income-oriented investors, despite sectorial challenges.
📊 Overview
Union Pacific Corporation, operating within the transportation sector, maintains a dividend yield of 2.42%, indicating moderate income potential for investors. The current dividend per share stands at $5.29, reflective of stable dividend payments over 46 years, with no recent cuts or suspensions.
| Metric | Value |
|---|---|
| Sector | Transportation |
| Dividend yield | 2.42 % |
| Current dividend per share | 5.29 USD |
| Dividend history | 46 years |
| Last cut or suspension | None |
📈 Dividend History
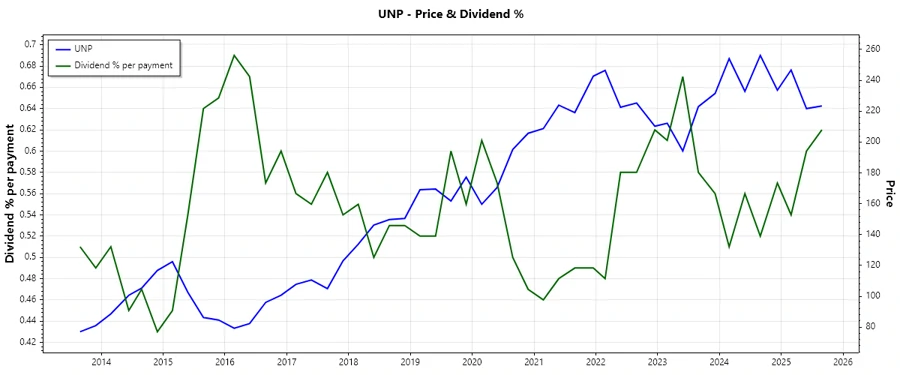
The dividend history of Union Pacific Corporation highlights consistent increases, reinforcing investor confidence in its financial stability. Historical patterns suggest a defensive approach to sustaining payouts amidst economic fluctuations.
| Year | Dividend Per Share |
|---|---|
| 2025 | $4.06 |
| 2024 | $5.28 |
| 2023 | $5.20 |
| 2022 | $5.08 |
| 2021 | $4.29 |
📉 Dividend Growth
Recent dividend growth shows that Union Pacific Corporation has achieved a 3-year dividend growth rate of 7.17% and a 5-year rate of 7.37%. Such figures highlight the company's commitment to gradually increasing shareholder returns over extended periods.
| Time | Growth |
|---|---|
| 3 years | 7.17 % |
| 5 years | 7.37 % |
The average dividend growth is 7.37% over 5 years. This shows moderate but steady dividend growth.
✅ Payout Ratio
The payout ratio metrics indicate the sustainability of dividend payments. An EPS-based payout ratio of 45.30% and a free cash flow-based payout ratio of 50.09% suggest that Union Pacific's dividends are well covered, ensuring room for reinvestment and potential growth.
| Key figure | Ratio |
|---|---|
| EPS-based | 45.30 % |
| Free cash flow-based | 50.09 % |
These ratios demonstrate a prudent balancing act by management, aligning distribution capabilities with financial performance.
🤑 Cashflow & Capital Efficiency
Analyzing the cash flow and capital efficiency illustrates Union Pacific's adept resource management. The company’s free cash flow and capital investment ratios signify an efficient allocation of resources to maximize shareholder value.
| Year | 2024 | 2023 | 2022 |
|---|---|---|---|
| Free Cash Flow Yield | 4.25 % | 3.19 % | 4.45 % |
| Earnings Yield | 4.87 % | 4.26 % | 5.43 % |
| CAPEX to Operating Cash Flow | 36.48 % | 43.04 % | 38.67 % |
| Stock-based Compensation to Revenue | 0.00 % | 0.00 % | 0.40 % |
| Free Cash Flow / Operating Cash Flow Ratio | 63.06 % | 56.96 % | 61.33 % |
Such financial health is essential for enduring market volatility, improving cash flow sustainability, and enhancing return on invested capital.
🔍 Balance Sheet & Leverage Analysis
Union Pacific Corporation's financial leverage indicators depict the company's debt management strategies. Despite substantial leverage, interest coverage ratios remain robust, reinforcing its capability to meet liabilities without compromising operations.
| Year | 2024 | 2023 | 2022 |
|---|---|---|---|
| Debt-to-Equity | 1.92 | 2.31 | 2.87 |
| Debt-to-Assets | 47.94 % | 50.91 % | 53.41 % |
| Net Debt to EBITDA | 2.52 | 2.78 | 2.69 |
| Current Ratio | 0.77 | 0.81 | 0.72 |
Sound liquidity ratios and prudent capitalization strategies demonstrate effective risk management while underwriting future growth opportunities.
⭐ Fundamental Strength & Profitability
Union Pacific exhibits strong profitability metrics essential for sustained returns. High returns on equity and assets coupled with impressive margins underscore resilient business operations and strategic acumen.
| Year | 2024 | 2023 | 2022 |
|---|---|---|---|
| Return on Equity | 39.95 % | 43.14 % | 57.54 % |
| Return on Assets | 9.96 % | 9.50 % | 10.69 % |
| Net Profit Margin | 27.82 % | 26.45 % | 28.13 % |
| Research & Development to Revenue | 0.00 % | 0.00 % | 0.00 % |
Such fiscal discipline and strategic foresight ensure Union Pacific's capability to capitalize on emergent opportunities, thus enhancing shareholder wealth.
🗣️ Dividend Scoring System
| Criteria | Description | Score |
|---|---|---|
| Dividend yield | At 2.42%, the yield is competitive | 3/5 |
| Dividend Stability | 46 years of uninterrupted payments | 4/5 |
| Dividend growth | Moderate growth trend | 3.5/5 |
| Payout ratio | Below 50%, indicating room for growth | 4/5 |
| Financial stability | Sound coverage and leverage | 4/5 |
| Dividend continuity | Strong payout record | 4/5 |
| Cashflow Coverage | Robust cash flow ratios | 3.5/5 |
| Balance Sheet Quality | Prudent balance sheet practices | 3.5/5 |
29.5 out of 40
🗣️ Rating
Union Pacific Corporation boasts a commendable dividend profile that appeals to income-focused investors. While the yield is modest, its stability and growth underwrite a resilient income strategy. With sound financial health and a robust payout history, Union Pacific is a viable investment for those prioritizing long-term dividend security.
Smart Data Insight
Master the Perfect Entry & Exit for this Stock
Don't leave your profits to chance. Historically, this stock follows specific seasonal patterns that institutional traders use to maximize returns.
- ✅ Identify the "Golden Buying Window"
- ✅ Avoid high-risk correction cycles
- ✅ Backtested data from the last 20+ years