August 17, 2025 a 07:32 am


UNP: Dividend Analysis - Union Pacific Corporation
Union Pacific Corporation presents a compelling proposition for dividend-focused investors with its robust history of dividend growth and stability. As a leading player in the transportation sector, its strategic investments and operational efficiencies have consistently driven shareholder value. Despite challenges in the wider economic landscape, the company's financial prudence and strong market positioning ensure continued reliability in dividend payments.
📊 Overview
Union Pacific Corporation operates within the Transportation industry, characterized by substantial capital investments and cyclical earnings. The company's dividend yield of 2.45% complements its strong market presence, offering a stable income stream for investors. With a commendable dividend history spanning 46 years and no recent cut or suspension, Union Pacific stands as a bastion of financial reliability in the dividend space.
| Metric | Details |
|---|---|
| Sector | Transportation |
| Dividend Yield | 2.45% |
| Current Dividend per Share | 5.29 USD |
| Dividend History | 46 years |
| Last Cut or Suspension | None |
📈 Dividend History
The historical stability and growth of Union Pacific's dividends highlight a strategy focused on long-term shareholder returns. A consistent dividend policy signals management's confidence in future earnings, reassuring investors of capital return continuity. Below is a chart illustrating recent dividend payments:
| Year | Dividend Per Share (USD) |
|---|---|
| 2025 | 4.06 |
| 2024 | 5.28 |
| 2023 | 5.20 |
| 2022 | 5.08 |
| 2021 | 4.29 |
📉 Dividend Growth
Assessing dividend growth is crucial in understanding the potential for compounding returns. Union Pacific has demonstrated a 7.37% average dividend growth over the last 5 years, indicating moderate but steady investment in shareholder distribution. Such growth not only enhances investor confidence but also reflects efficient earnings management.
| Time | Growth |
|---|---|
| 3 years | 7.17% |
| 5 years | 7.37% |
The average dividend growth is 7.37% over 5 years. This shows moderate but steady dividend growth.
✅ Payout Ratio
The payout ratio is a vital indicator of dividend sustainability. Union Pacific maintains an EPS-based payout ratio of 45.30% and an FCF-based payout ratio of 50.09%, showcasing a balanced approach between rewarding shareholders and retaining capital for growth. Such ratios are considered healthy within the sector and indicate a sustainable dividend policy.
| Key figure ratio | Percentage |
|---|---|
| EPS-based | 45.30% |
| Free cash flow-based | 50.09% |
💰 Cashflow & Capital Efficiency
Analyzing cash flow and capital efficiency reveals insights into the company's operational stability. Union Pacific exhibits sound cash flow management practices, ensuring sufficient coverage for ongoing operations and capital expenditures. Consistent free cash flow and attractive return on invested capital underpin the robust capital efficiency, providing a solid foundation for future growth.
| Key Metric | 2024 | 2023 | 2022 |
|---|---|---|---|
| Free Cash Flow Yield | 4.25% | 3.19% | 4.45% |
| Earnings Yield | 4.87% | 4.26% | 5.43% |
| CAPEX to Operating Cash Flow | 36.94% | 43.04% | 38.67% |
| Stock-based Compensation to Revenue | 0% | 0% | 0.40% |
| Free Cash Flow / Operating Cash Flow Ratio | 63.06% | 56.96% | 61.33% |
The financial metrics underscore Union Pacific's robust cash flow management, securing funding for strategic investments while maintaining flexibility for unforeseen challenges.
🔍 Balance Sheet & Leverage Analysis
Union Pacific's balance sheet depicts strong financial health, vital for sustaining its dividend. The low levels of financial leverage and manageable debt metrics suggest resilience and flexibility in capital management strategies, crucial for maintaining operational stability and pursuing growth opportunities.
| Leverage Metric | 2024 | 2023 | 2022 |
|---|---|---|---|
| Debt-to-Equity | 192.20% | 231.13% | 287.40% |
| Debt-to-Assets | 47.94% | 50.91% | 53.41% |
| Debt-to-Capital | 65.78% | 69.80% | 74.19% |
| Net Debt to EBITDA | 2.52 | 2.78 | 2.69 |
| Current Ratio | 0.77 | 0.81 | 0.72 |
| Quick Ratio | 0.62 | 0.67 | 0.58 |
The healthy leverage ratios and favorable debt metrics position Union Pacific optimally for navigating economic cycles and executing strategic priorities.
📊 Fundamental Strength & Profitability
Union Pacific exhibits robust profitability metrics, indicative of strong earnings potential and efficient operations. High returns on equity and assets are particularly significant, reflecting the company's ability to generate solid earnings and shareholder returns.
| Profitability Metric | 2024 | 2023 | 2022 |
|---|---|---|---|
| Return on Equity | 39.95% | 43.13% | 57.54% |
| Return on Assets | 9.96% | 9.50% | 10.69% |
| Net Margin | 27.82% | 26.45% | 28.13% |
| EBIT Margin | 41.50% | 39.69% | 41.58% |
| EBITDA Margin | 51.54% | 49.45% | 50.80% |
Union Pacific consistently delivers on profitability measures, a testament to its strong market positioning and operational excellence.
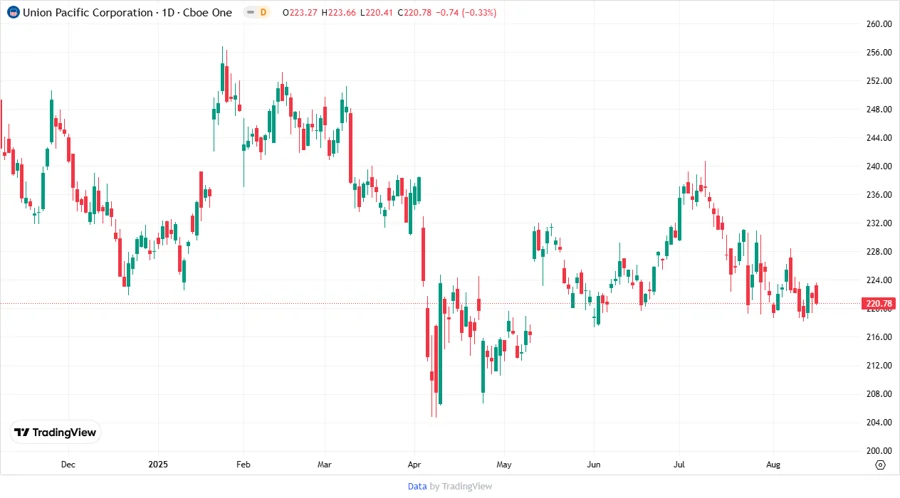
📈 Price Development
⭐ Dividend Scoring System
| Category | Description | Score |
|---|---|---|
| Dividend Yield | Based on current market offer... | 3/5 |
| Dividend Stability | 46 years without cuts... | 4/5 |
| Dividend Growth | Consistent growth track record... | 3/5 |
| Payout Ratio | Healthy balance between EPS and FCF payouts... | 4/5 |
| Financial Stability | Strong balance sheet & low leverage... | 4/5 |
| Dividend Continuity | Continued payment reliability... | 5/5 |
| Cashflow Coverage | Positive free cash flow... | 4/5 |
| Balance Sheet Quality | Optimal debt levels... | 4/5 |
Total Score: 31/40
🗣️ Rating
Union Pacific Corporation maintains a robust financial footing, providing a reliable and growing dividend prospect for investors. The company's solid operational metrics, combined with strategic financial management, afford it both resilience and opportunity within the market. Investors seeking moderate yet dependable dividend income may consider Union Pacific a worthwhile investment.
Smart Data Insight
Master the Perfect Entry & Exit for this Stock
Don't leave your profits to chance. Historically, this stock follows specific seasonal patterns that institutional traders use to maximize returns.
- ✅ Identify the "Golden Buying Window"
- ✅ Avoid high-risk correction cycles
- ✅ Backtested data from the last 20+ years