June 18, 2025 a 03:31 pm


UNP: Dividend Analysis - Union Pacific Corporation
Union Pacific Corporation (UNP) has exhibited a consistent dividend history with a commendable dividend yield of 2.42%. The company has maintained its dividend payouts for 46 years, highlighting its fiscal resilience. The moderate dividend growth rates over the past years underscore its sustainable dividend policy aligned with long-term shareholder value creation.
📊 Overview
Examining Union Pacific Corporation's dividend profile reveals a robust history of 46 years without any suspensions, indicating a strong commitment to returning cash to shareholders. Its sector, the transportation industry, is renowned for stable cash flows supporting such a dividend strategy.
| Attribute | Detail |
|---|---|
| Sector | Transportation |
| Dividend yield | 2.42% |
| Current dividend per share | 5.29 USD |
| Dividend history | 46 years |
| Last cut or suspension | None |
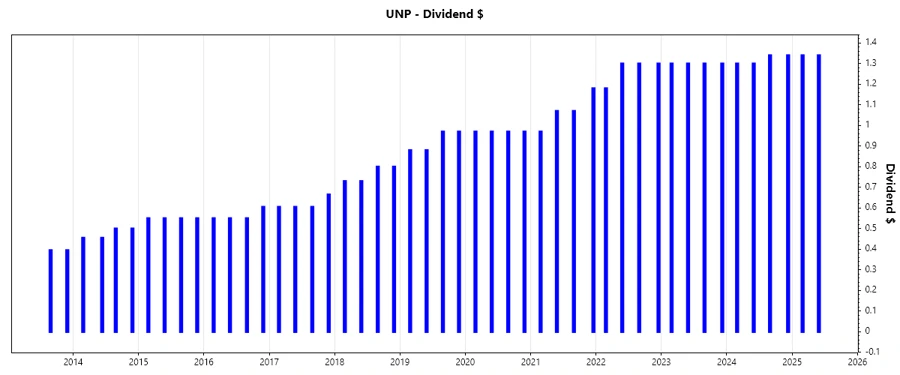
🗣️ Dividend History
Union Pacific's dividend consistency over 46 years fortifies its reputation among income-focused investors. This historical stability is pivotal, especially during economic volatilities, providing assurance of regular income.
| Year | Dividend per Share (USD) |
|---|---|
| 2025 | 2.68 |
| 2024 | 5.28 |
| 2023 | 5.2 |
| 2022 | 5.08 |
| 2021 | 4.29 |
📈 Dividend Growth
The growth of dividends over time reflects a company's capability to increase cash returns to shareholders. Union Pacific shows a moderate growth trend with 7.14% over 3 years and 7.37% over 5 years.
| Time | Growth |
|---|---|
| 3 years | 7.17% |
| 5 years | 7.37% |
The average dividend growth is 7.37% over 5 years. This shows moderate but steady dividend growth.
📉 Payout Ratio
Payout ratios provide insights into dividend safety by assessing earnings and cash flow adequacy. Union Pacific maintains a balance with a 47.21% EPS-based payout and a 53.80% free cash flow-based payout, indicating a sustainable dividend policy.
| Key Figure Ratio | |
|---|---|
| EPS-based | 47.21% |
| Free cash flow-based | 53.80% |
The EPS-based payout of 47.21% demonstrates prudent allocation of earnings, while the FCF payout at 53.80% is also decent, ensuring earnings stability.
✅ Cashflow & Capital Efficiency
Analysing cash flows provides a glimpse into the operational efficiency and financial health of a company. Free cash yields and how capital is deployed are crucial in sustaining dividends and future growth.
| Metric | 2023 | 2024 | 2022 |
|---|---|---|---|
| Free Cash Flow Yield | 4.43% | 4.25% | 4.45% |
| Earnings Yield | 5.05% | 4.87% | 5.43% |
| CAPEX to Operating Cash Flow | 37.75% | 36.93% | 38.67% |
| Stock-based Compensation to Revenue | 0.12% | 0.00% | 0.40% |
| Free Cash Flow / Operating Cash Flow Ratio | 63.06% | 63.06% | 61.33% |
The cash flow stability is supported by strong yields and capital efficiency ratios, indicating adept capital management and robust operational cash flow generation.
⚠️ Balance Sheet & Leverage Analysis
Understanding the debt levels and liquidity positions is vital against the backdrop of maintaining dividend payments and navigating through financial obligations.
| Metric | 2023 | 2024 | 2022 |
|---|---|---|---|
| Debt-to-Equity | 1.92 | 1.92 | 2.85 |
| Debt-to-Assets | 0.48 | 0.48 | 0.53 |
| Debt-to-Capital | 0.66 | 0.66 | 0.74 |
| Net Debt to EBITDA | 2.60 | 2.52 | 2.66 |
| Current Ratio | 0.76 | 0.76 | 0.71 |
| Quick Ratio | 0.62 | 0.62 | 0.58 |
| Financial Leverage | 4.01 | 4.01 | 5.38 |
The company's leverage position improved compared to prior years, indicating effective debt management and enhancing its financial stability.
🔍 Fundamental Strength & Profitability
Profitability metrics highlight the core business strength and operational management efficiency, crucial for sustaining dividends.
| Metric | 2023 | 2024 | 2022 |
|---|---|---|---|
| Return on Equity | 40.80% | 39.95% | 57.54% |
| Return on Assets | 9.83% | 9.96% | 10.69% |
| Margins: Net | 27.23% | 25.31% | 28.13% |
| Margins: EBIT | 41.50% | 39.69% | 41.47% |
| Margins: EBITDA | 51.54% | 51.54% | 50.79% |
| Margins: Gross | 45.22% | 45.65% | 45.05% |
| R&D to Revenue | 0.0% | 0.0% | 0.0% |
The company demonstrates strong fundamental solidity with consistent returns, evidencing robust profitability that supports dividend payments.
📈 Price Development
🏆 Dividend Scoring System
| Category | Description | Score |
|---|---|---|
| Dividend Yield | Assessment based on current yield | |
| Dividend Stability | Years of unchanged dividend or growth | |
| Dividend Growth | Assessment of growth over 5 years | |
| Payout Ratio | Level of sustainable payout | |
| Financial Stability | Leverage and liquidity analysis | |
| Dividend Continuity | Historical payout without cuts | |
| Cashflow Coverage | Free cash flow sufficiency | |
| Balance Sheet Quality | Assessment of debt and equity structure |
Total Score: 33/40
💬 Rating
Union Pacific's stable and growing dividends, coupled with their conservative payout ratios, make it a strong choice for dividend-oriented investors. The sound financial fundamentals and moderate leverage suggest that it is well-positioned for continued dividend reliability, thereby earning a favorable investment rating.
Smart Data Insight
Master the Perfect Entry & Exit for this Stock
Don't leave your profits to chance. Historically, this stock follows specific seasonal patterns that institutional traders use to maximize returns.
- ✅ Identify the "Golden Buying Window"
- ✅ Avoid high-risk correction cycles
- ✅ Backtested data from the last 20+ years