
June 19, 2026 a 08:00 am
UNH: Fundamental Ratio Analysis - UnitedHealth Group Incorporated
UnitedHealth Group Incorporated (UNH) has exhibited stable financial performance through its comprehensive healthcare services. With a diverse range of operations and strong presence in the healthcare sector, it remains an attractive choice for investors seeking stability and moderate growth. However, investors should remain cautious about the evolving competitive landscape and potential regulatory changes.
Fundamental Rating
The fundamental rating indicates a strong performance with specific strengths and weaknesses in key areas.
| Category | Score | Visualization |
|---|---|---|
| Discounted Cash Flow | 4 | |
| Return on Equity | 4 | |
| Return on Assets | 4 | |
| Debt to Equity | 1 | |
| Price to Earnings | 2 | |
| Price to Book | 3 |
Historical Rating
Comparison of current and past performance scores.
| Date | Overall | DCF | ROE | ROA | Debt/Equity | P/E | P/B |
|---|---|---|---|---|---|---|---|
| 2026-06-18 | 3 | 4 | 4 | 4 | 1 | 2 | 3 |
| Previous | 0 | 4 | 4 | 4 | 1 | 2 | 3 |
Analyst Price Targets
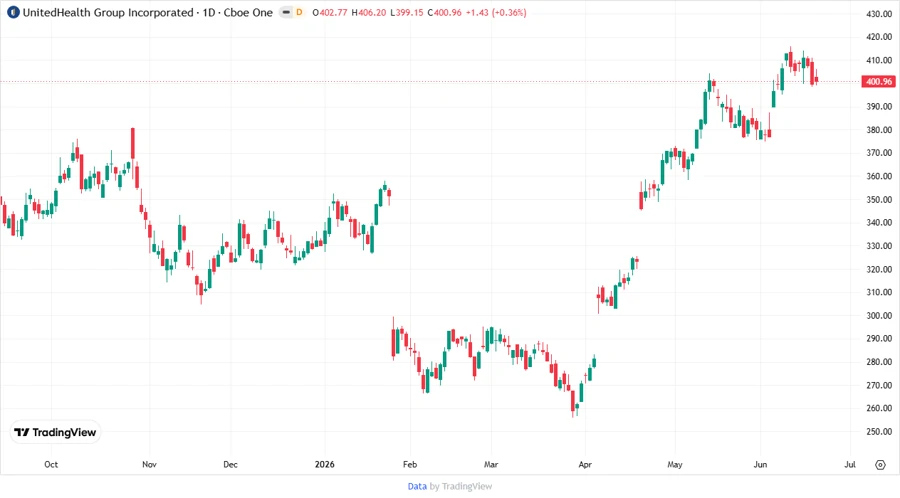
The price target assessment offers a range of potential outcomes for the UNH stock over the coming months.
| High | Low | Median | Consensus |
|---|---|---|---|
| 492 | 361 | 432 | 425.81 |
Analyst Sentiment
The sentiment breakdown provides insights into the analysts' recommendations for UNH.
| Recommendation | Count | Distribution |
|---|---|---|
| Strong Buy | 0 | |
| Buy | 43 | |
| Hold | 5 | |
| Sell | 4 | |
| Strong Sell | 0 |
Conclusion
UnitedHealth Group Incorporated's stock analysis reveals a well-rounded performance. With a balanced fundamental score and positive analyst sentiment, UNH presents a compelling case for long-term investors. While the debt to equity ratio is a minor concern, the company's strong cash flow and earnings potential mitigate major risk factors. Regulatory challenges in the healthcare industry remain a factor to monitor.
Smart Data Insight
Master the Perfect Entry & Exit for this Stock
Don't leave your profits to chance. Historically, this stock follows specific seasonal patterns that institutional traders use to maximize returns.
- ✅ Identify the "Golden Buying Window"
- ✅ Avoid high-risk correction cycles
- ✅ Backtested data from the last 20+ years