August 14, 2025 a 06:44 am
UNH: Fibonacci Analysis - UnitedHealth Group Incorporated
The UnitedHealth Group (UNH) stock has shown significant volatility over the past few months, reflecting broader dynamics in the healthcare sector. With a broad healthcare network through UnitedHealthcare and Optum segments, UNH's stock performance offers an insight into market reactions to regulatory and competitive changes in the industry. Trading within a range recently, the stock has encountered both support and resistance points critical for technical traders.
Fibonacci Analysis
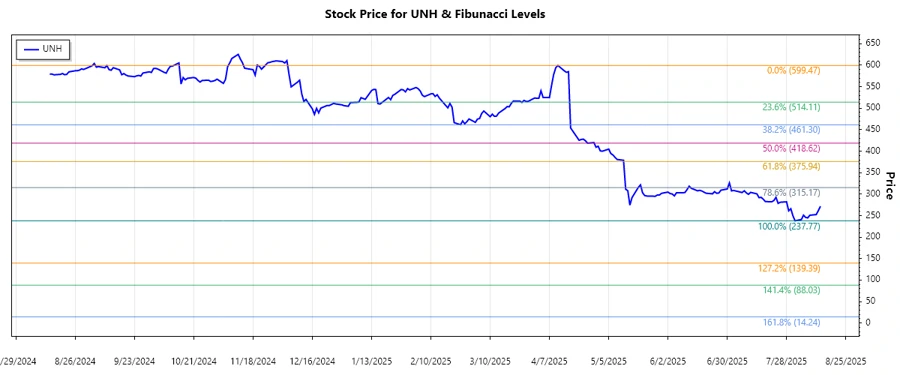
A detailed analysis of the UnitedHealth Group stock reveals a dominant downward trend in recent months. Leveraging the high of $599.47 on April 11, 2025, and a low of $237.77 on August 1, 2025, we can calculate Fibonacci retracement levels to identify potential support and resistance areas.
| Factor | Price Level |
|---|---|
| 0.236 | $332.87 |
| 0.382 | $366.75 |
| 0.5 | $418.62 |
| 0.618 | $470.49 |
| 0.786 | $516.46 |
As of the latest price, which stands at $271.81 (August 13, 2025), the stock is trading below all major Fibonacci levels. Hence, the current pricing falls outside the retracement zones indicated.
Technical Interpretation: The stock has not entered any Fibonacci retracement zone, emphasizing its continued weakness. Should the price reach a retracement level, these could serve as potential resistance areas.
Illustrating the price movement, the above chart highlights key levels and trend directions.
Conclusion
The UnitedHealth Group stock is navigating through a pronounced downtrend, heavily influenced by external market conditions and internal company performance. Given current technical levels, investors should be cautious and consider the potential resistance posed by Fibonacci levels. While downside risks remain prevalent, an eventual reversal or price stabilization could present trading opportunities at defined levels. Traders attentive to these Fibonacci levels could anticipate key opportunities for entry or exit.
Smart Data Insight
Master the Perfect Entry & Exit for this Stock
Don't leave your profits to chance. Historically, this stock follows specific seasonal patterns that institutional traders use to maximize returns.
- ✅ Identify the "Golden Buying Window"
- ✅ Avoid high-risk correction cycles
- ✅ Backtested data from the last 20+ years