February 20, 2026 a 07:31 am

📊 UNH: Dividend Analysis - UnitedHealth Group Incorporated
UnitedHealth Group Incorporated presents a robust profile characterized by a moderate yet stable dividend yield alongside a steady dividend growth trajectory over the past years. With consistent payments spanning three decades, the company maintains a commitment to shareholder returns. Strategic management of balances and capital efficiencies highlight its operational robustness, warranting a closer evaluation.
🗣️ Overview
UnitedHealth Group operates within the ever-dynamic healthcare sector, offering investors a dividend yield of 2.70%. With a current dividend per share amounting to $8.70, the company has a remarkable dividend history spanning 36 years. The last dividend cut occurred in 1999, indicating resilience and strong financial stewardship.
| Metric | Details |
|---|---|
| Sector | Healthcare |
| Dividend Yield | 2.70% |
| Current Dividend per Share | $8.70 |
| Dividend History | 36 years |
| Last Cut or Suspension | 1999 |
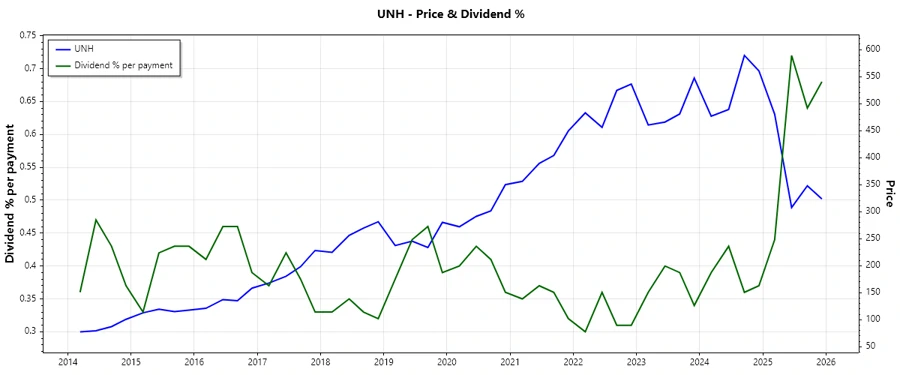
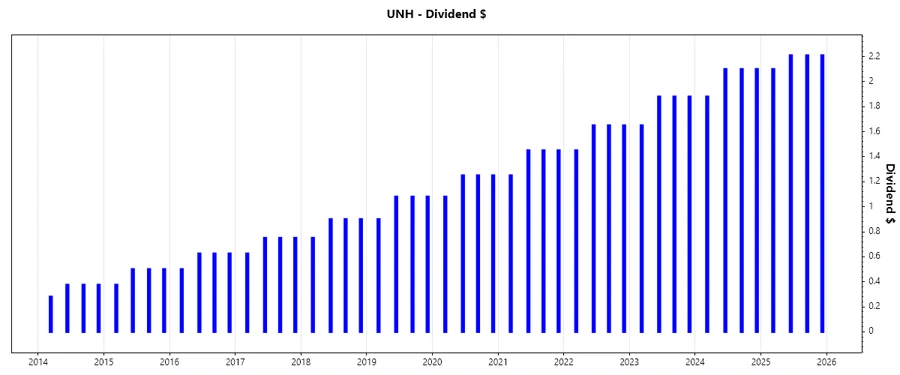
📈 Dividend History
The perennial strength of UnitedHealth Group is evident in its dividend disbursement history, reflecting the company's unwavering commitment to shareholders. Such consistency is instrumental for long-term investors seeking steady income streams.
| Year | Dividend per Share (USD) |
|---|---|
| 2025 | 8.73 |
| 2024 | 8.18 |
| 2023 | 7.29 |
| 2022 | 6.40 |
| 2021 | 5.60 |
📈 Dividend Growth
The growth trajectory of dividends offers profound insights into the company's ability to enhance shareholder value. Over the past three and five years, the dividend has experienced growth, indicating a forward-looking financial strategy.
| Time | Growth |
|---|---|
| 3 years | 10.90% |
| 5 years | 12.57% |
The average dividend growth is 12.57% over 5 years. This shows moderate but steady dividend growth.
🧮 Payout Ratio
The payout ratio is crucial as it portrays the proportion of earnings distributed as dividends. UnitedHealth Group showcases a payout ratio of 65.66% based on EPS and 49.02% based on free cash flow, signifying a robust capability to sustain dividends while covering obligations.
| Key figure | Ratio |
|---|---|
| EPS-based | 65.66% |
| Free cash flow-based | 49.02% |
The EPS payout ratio of 65.66% and the FCF payout ratio of 49.02% reflect a balanced dividend policy, ensuring returns while retaining earnings for growth.
💰 Cashflow & Capital Efficiency
Understanding the cashflow dynamics is essential when assessing a company's financial vitality. UnitedHealth exhibits a free cash flow yield of 6.12%, supported by an earnings yield of 4.57%. The CAPEX to Operating Cash Flow ratio indicates strategic investment in sustaining operations.
| Year | 2025 | 2024 | 2023 |
|---|---|---|---|
| Free Cash Flow Yield | 5.35% | 4.41% | 5.26% |
| Earnings Yield | 4.01% | 3.07% | 4.58% |
| CAPEX to Operating Cash Flow | 18.39% | 14.46% | 11.65% |
| Stock-based Compensation to Revenue | 0.22% | 0.25% | 0.28% |
| Free Cash Flow / Operating Cash Flow Ratio | 81.61% | 85.54% | 88.35% |
The exemplary cashflow management with substantial ratios underscores UnitedHealth's financial resilience and efficient capital employment, making it a promising investment opportunity.
🏦 Balance Sheet & Leverage Analysis
A comprehensive analysis of leverage ratios provides insights into the firm's financial risk level. UnitedHealth's judicious financial leverage of 3.09x and a debt-to-equity of 0.78x suggest prudent financial management.
| Year | 2025 | 2024 | 2023 |
|---|---|---|---|
| Debt-to-Equity | 0.78 | 0.83 | 0.76 |
| Debt-to-Assets | 0.25 | 0.26 | 0.25 |
| Debt-to-Capital | 0.44 | 0.45 | 0.43 |
| Net Debt to EBITDA | 2.18 | 1.84 | 1.16 |
| Current Ratio | 0.79 | 0.83 | 0.79 |
| Quick Ratio | 0.79 | 0.83 | 0.79 |
| Financial Leverage | 3.09 | 3.22 | 3.08 |
The evaluation reflects a resilient balance sheet with sustainable debt levels, enhancing liquidity and financial flexibility.
💹 Fundamental Strength & Profitability
Examining profitability ratios illuminates the firm's operational excellence. UnitedHealth demonstrates robust returns on equity and assets, combined with solid margins, reinforcing its competitive positioning.
| Year | 2025 | 2024 | 2023 |
|---|---|---|---|
| Return on Equity | 12.05% | 15.55% | 25.22% |
| Return on Assets | 3.89% | 4.83% | 8.18% |
| Margins: Net | 2.69% | 3.60% | 6.02% |
| Margins: EBIT | 4.18% | 5.99% | 8.71% |
| Margins: EBITDA | 5.15% | 7.01% | 9.78% |
| Margins: Gross | 18.53% | 22.33% | 24.48% |
| Research & Development to Revenue | 0% | 0% | 0% |
Diverse profitability metrics signify optimal cost management and revenue use, establishing UnitedHealth as a fundamentally strong entity.
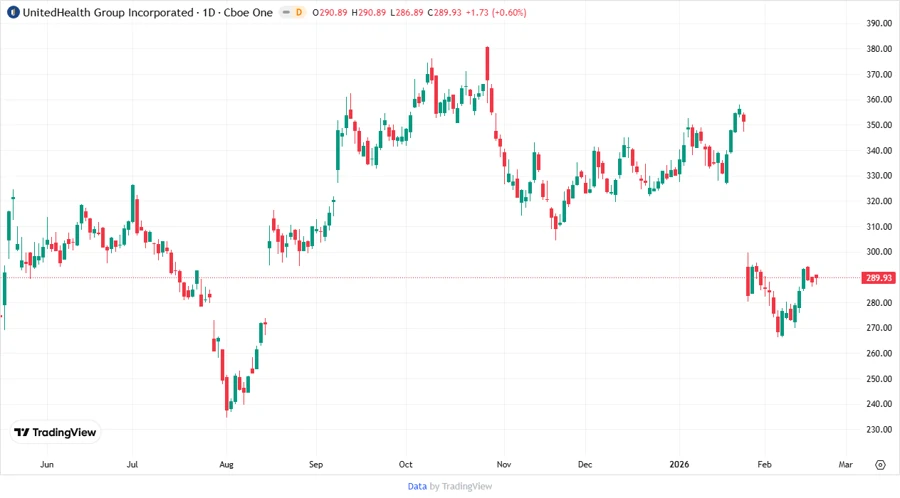
📉 Price Development
✅ Dividend Scoring System
To assess the dividend profile's health, each category is rated on a scale of 1 to 5, aggregating to a holistic score.
| Factor | Score | Representation |
|---|---|---|
| Dividend Yield | 4 | |
| Dividend Stability | 5 | |
| Dividend Growth | 4 | |
| Payout Ratio | 3 | |
| Financial Stability | 5 | |
| Dividend Continuity | 5 | |
| Cashflow Coverage | 4 | |
| Balance Sheet Quality | 5 |
Total Score: 35/40
📈 Rating
UnitedHealth Group stands out as a fundamentally robust investment epitomized by impressive dividend history, growth prospects, and financial stability. Investors seeking long-term equity exposure with a dependable income stream will find this stock favorable. Overall, it holds a "Buy" recommendation underpinned by resilient financials and consistent shareholder returns.