September 25, 2025 a 11:32 am

UNH: Dividend Analysis - UnitedHealth Group Incorporated
UnitedHealth Group Incorporated demonstrates a resilient dividend profile with continued growth prospects. The company boasts a robust history of 36 consecutive years of dividend distributions, underscoring its commitment to returning value to shareholders. With a current dividend yield of approximately 2.48%, UnitedHealth provides a stable income stream for investors in the healthcare sector. The progressive dividend trajectory is supported by a sound financial foundation, ensuring sustainability amid varying economic conditions.
📊 Overview
The following table provides a snapshot of UnitedHealth's key dividend metrics, highlighting its sector performance and historical growth:
| Sector | Dividend Yield | Current Dividend per Share | Dividend History | Last Cut or Suspension |
|---|---|---|---|---|
| Healthcare | 2.48% | 8.11 USD | 36 years | None |
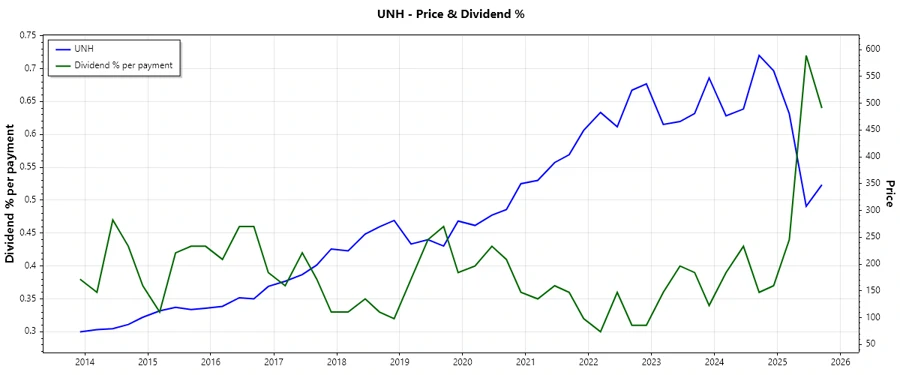
📈 Dividend History
UnitedHealth's consistent dividend payments highlight the management's dedication to shareholders. Long-term growth and periodic increases have been fundamental to this commitment. The chart below illustrates the historical context of its dividends:
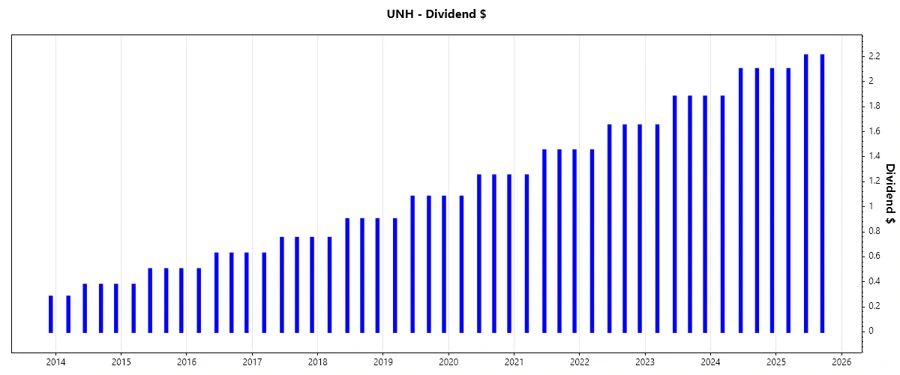
| Year | Dividend per Share (USD) |
|---|---|
| 2025 | 6.52 |
| 2024 | 8.18 |
| 2023 | 7.29 |
| 2022 | 6.40 |
| 2021 | 5.60 |
📊 Dividend Growth
Analyzing dividend growth provides insights into UnitedHealth's potential for increasing shareholder value. Over the past years, the company's dividend growth remains promising:
| Time | Growth |
|---|---|
| 3 years | 13.46% |
| 5 years | 14.59% |
The average dividend growth is 14.59% over 5 years. This shows moderate but steady dividend growth.
⚠️ Payout Ratio
The payout ratio is critical in assessing dividend sustainability. UnitedHealth maintains prudent payout levels:
| Key Figure | Ratio |
|---|---|
| EPS-based | 34.65% |
| Free cash flow-based | 29.06% |
These figures suggest a conservative payout strategy, allowing for continued investment in growth and stability.
💹 Cashflow & Capital Efficiency
The following metrics provide insights into UnitedHealth's cash flow dynamics and capital efficiency:
| Year | 2024 | 2023 | 2022 |
|---|---|---|---|
| Free Cash Flow Yield | 4.41% | 5.26% | 4.73% |
| Earnings Yield | 3.07% | 4.58% | 4.06% |
| CAPEX to Operating Cash Flow | 14.46% | 11.65% | 10.69% |
| Stock-based Compensation to Revenue | 0.25% | 0.28% | 0.29% |
| Free Cash Flow / Operating Cash Flow Ratio | 85.54% | 88.35% | 89.31% |
The substantial cash flow efficiency and minimal reliance on stock compensation suggest robust capital utilization strategies.
💰 Balance Sheet & Leverage Analysis
Examining the balance sheet provides insights into UnitedHealth's leverage and financial stability:
| Year | 2024 | 2023 | 2022 |
|---|---|---|---|
| Debt-to-Equity | 83.00% | 75.98% | 74.09% |
| Debt-to-Assets | 25.78% | 24.64% | 23.45% |
| Debt-to-Capital | 45.35% | 43.17% | 42.56% |
| Net Debt to EBITDA | 1.84 | 1.29 | 1.08 |
| Current Ratio | 0.83 | 0.79 | 0.77 |
| Quick Ratio | 0.83 | 0.79 | 0.77 |
| Financial Leverage | 3.22 | 3.08 | 3.16 |
The leverage ratios demonstrate controlled debt levels, contributing to a solid balance sheet profile.
📉 Fundamental Strength & Profitability
Profitability metrics are essential in understanding the company's efficiency in using its resources to generate returns:
| Year | 2024 | 2023 | 2022 |
|---|---|---|---|
| Return on Equity | 15.55% | 25.22% | 25.87% |
| Return on Assets | 4.83% | 8.18% | 8.19% |
| Margins: Net | 3.60% | 6.02% | 6.21% |
| Margins: EBIT | 5.99% | 7.68% | 8.77% |
| Margins: EBITDA | 7.01% | 8.75% | 9.82% |
| Margins: Gross | 22.33% | 24.48% | 24.56% |
Consistent returns on equity and stable net margins reflect efficient management and operations.
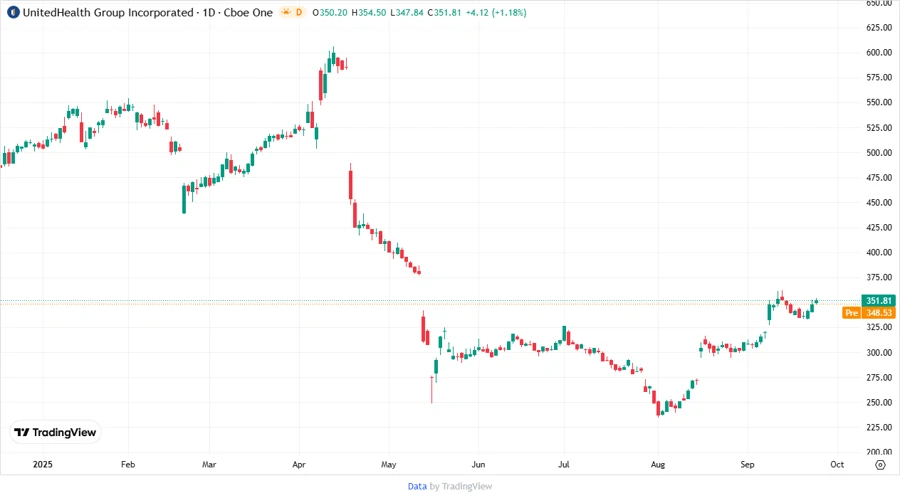
📈 Price Development
✅ Dividend Scoring System
| Category | Score | Score Bar |
|---|---|---|
| Dividend Yield | 4 | |
| Dividend Stability | 5 | |
| Dividend Growth | 4 | |
| Payout Ratio | 4 | |
| Financial Stability | 5 | |
| Dividend Continuity | 5 | |
| Cashflow Coverage | 5 | |
| Balance Sheet Quality | 5 |
Overall Score: 37/40
🗣️ Rating
UnitedHealth Group Incorporated holds a strong dividend profile with a stable and growing payout history, backed by its robust financial performance. The high dividend score of 37 reflects its commitment to shareholder returns, making it an attractive choice for income-focused investors.
Smart Data Insight
Master the Perfect Entry & Exit for this Stock
Don't leave your profits to chance. Historically, this stock follows specific seasonal patterns that institutional traders use to maximize returns.
- ✅ Identify the "Golden Buying Window"
- ✅ Avoid high-risk correction cycles
- ✅ Backtested data from the last 20+ years