May 20, 2026 a 03:15 am
ULTA: Trend and Support & Resistance Analysis - Ulta Beauty, Inc.
Ulta Beauty, Inc. (ULTA) has shown consistent growth over the past few months despite market volatility. As a leader in the beauty retail sector, it continues to expand its product offerings and online presence. Recent trends in its stock price reflect broader market movements, but it remains a key player worth monitoring. Investors should pay particular attention to technical indicators and zones to assess potential entry and exit points.
Trend Analysis
| Date | Close Price | Trend |
|---|---|---|
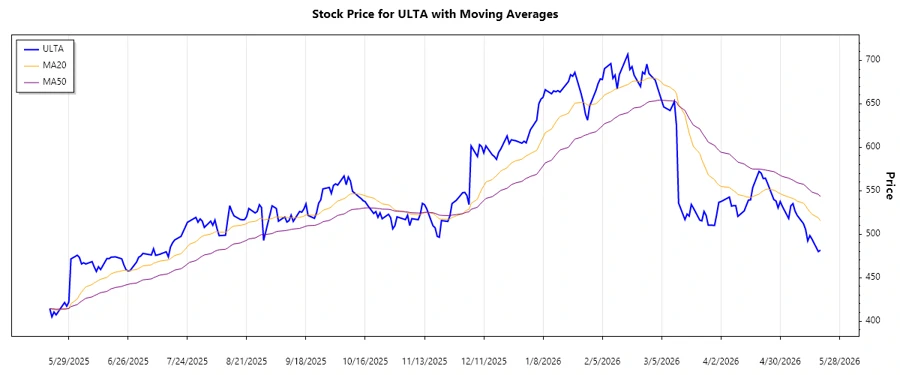
| 2026-05-19 | 481.56 | ▼ Abwärtstrend |
| 2026-05-18 | 479.87 | ▼ Abwärtstrend |
| 2026-05-15 | 494.28 | ▼ Abwärtstrend |
| 2026-05-14 | 498.28 | ▼ Abwärtstrend |
| 2026-05-13 | 492.15 | ▼ Abwärtstrend |
| 2026-05-12 | 505.20 | ▼ Abwärtstrend |
| 2026-05-11 | 511.98 | ▼ Abwärtstrend |
The recent data shows a dominant bearish trend as indicated by the EMA values, with EMA20 falling below EMA50 consistently in the last week.
Support and Resistance
| Zone Type | From | To |
|---|---|---|
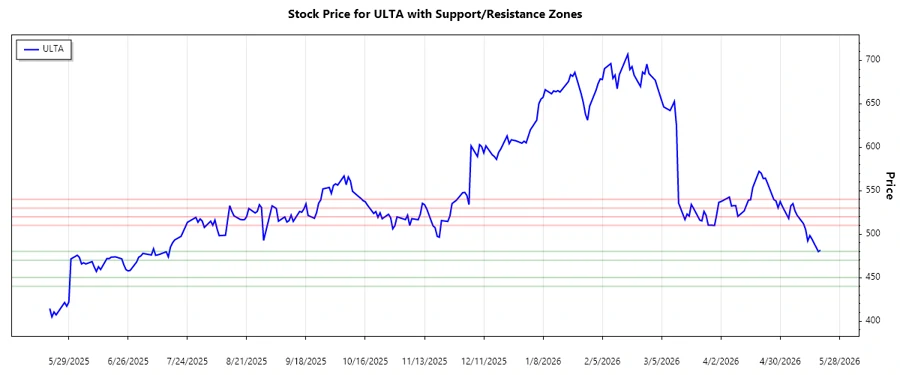
| Support Zone 1 | 470 | 480 |
| Support Zone 2 | 440 | 450 |
| Resistance Zone 1 | 510 | 520 |
| Resistance Zone 2 | 530 | 540 |
The current price has broken below the first support zone and is heading towards the second. This suggests a potential for further downside or consolidation within the lower range.
Conclusion
Ulta Beauty, Inc. (ULTA) is experiencing a noticeable decline, reflected by the downward trend in the EMA indicators. The breach into the support zones indicates increasing selling pressure, and potential investors should be wary of further declines. Support and resistance levels suggest limited upside unless significant market changes restore investor confidence. Meanwhile, the company's expansive presence and robust online platform continue to support its long-term viability, posing moderate risk against short-term uncertainties.
Smart Data Insight
Master the Perfect Entry & Exit for this Stock
Don't leave your profits to chance. Historically, this stock follows specific seasonal patterns that institutional traders use to maximize returns.
- ✅ Identify the "Golden Buying Window"
- ✅ Avoid high-risk correction cycles
- ✅ Backtested data from the last 20+ years