February 21, 2026 a 01:15 pm

ULTA: Trend and Support & Resistance Analysis - Ulta Beauty, Inc.
Ulta Beauty, Inc., a dominant name in the beauty retail sector, has shown a robust upward trajectory this period. The company continues to leverage its expansive product range and retail network, reflecting positively in its stock performance. However, recent fluctuations hint at potential resistance levels which could moderate future gains. Analyzing the company's stock trends and key zones can reveal insights into its market dynamics and future trajectory.
Trend Analysis
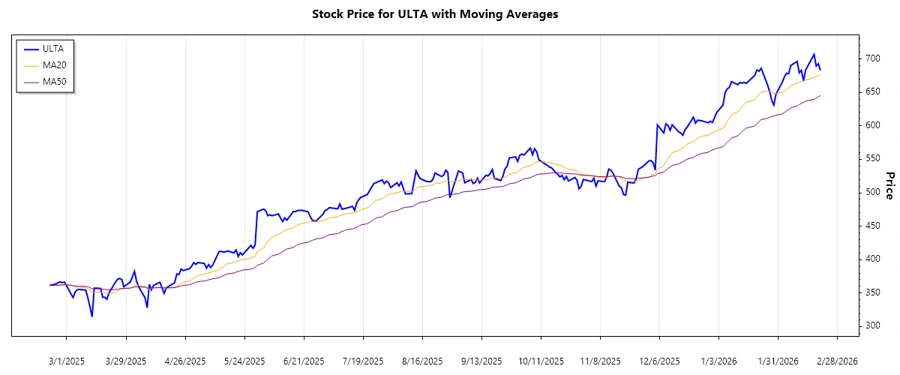
The recent trend of the ULTA stock displays a strong upward momentum. Calculations of the EMA (Exponential Moving Average) based on the closing prices indicate:
- EMA20: 665.93
- EMA50: 608.47
Since EMA20 > EMA50, we identify a ▲ strong upward trend in place. Analysis based on the last seven trading days reveals the following details:
| Date | Close Price | Trend |
|---|---|---|
| 2026-02-20 | $682.89 | ▲ |
| 2026-02-19 | $692.79 | ▲ |
| 2026-02-18 | $689.42 | ▲ |
| 2026-02-17 | $706.82 | ▲ |
| 2026-02-13 | $683.40 | ▲ |
| 2026-02-12 | $667.18 | ▲ |
| 2026-02-11 | $683.05 | ▲ |
This consistent upward movement suggests that investors maintain confidence in Ulta Beauty's market position and potential for growth.
Support and Resistance
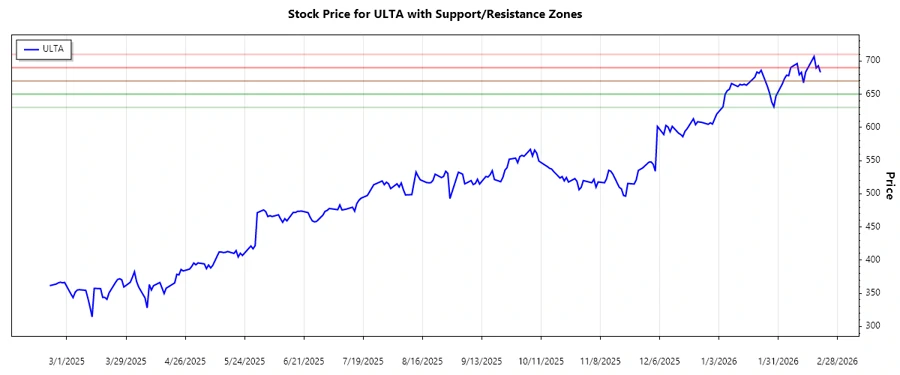
Currently, the analysis of support and resistance levels based on recent data identifies the following zones:
| Zone | From | To |
|---|---|---|
| Resistance Zone 1 | 690.00 ▲ | 710.00 ▲ |
| Resistance Zone 2 | 670.00 ▲ | 690.00 ▲ |
| Support Zone 1 | 650.00 ▼ | 670.00 ▼ |
| Support Zone 2 | 630.00 ▼ | 650.00 ▼ |
As of now, the current price level places it around the Resistance Zone 1, positioning it near critical levels that may face selling pressure. Understanding these dynamics allows investors to anticipate potential reversal points.
Conclusion
Overall, Ulta Beauty, Inc.'s share price exhibits strong growth momentum, buoyed by favorable market conditions and solid corporate strategies. Despite its promising upward trend, the current price proximity to resistance zones suggests caution, with potential consolidation or downward movement if these zones aren't surpassed shortly. Investors observe these technical levels with interest, as they gauge potential entry or exit points.
json This analysis provides a comprehensive review of Ulta Beauty's stock performance, highlighting the trend and significant support and resistance levels.