May 04, 2026 a 10:15 am
ULTA: Fibonacci Analysis - Ulta Beauty, Inc.
Ulta Beauty, Inc., a major player in the beauty retail sector in the United States, has shown significant fluctuations in its stock price over the past several months. The recent trend indicates a downturn after a prolonged positive streak. With the industry's continuous evolution, Ulta Beauty remains a strong brand, yet market volatility suggests careful monitoring of price movements.
Fibonacci Analysis
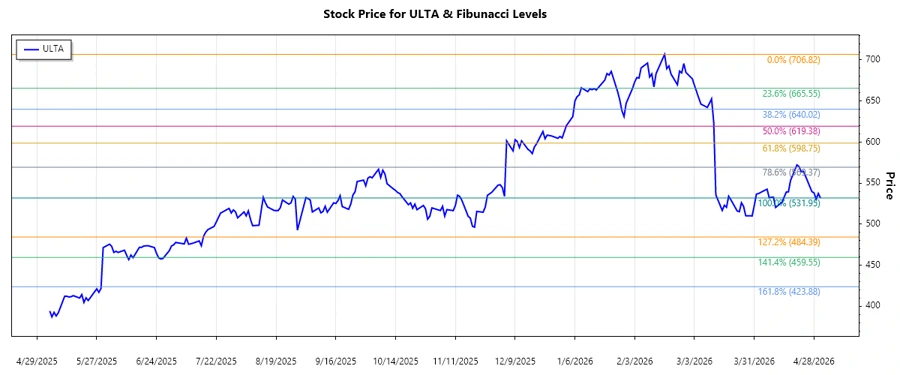
The analysis of Ulta Beauty's stock, using historical data, reveals a dominant downtrend. The trend began shortly after February 17, 2026, and reached a notable low around May 1, 2026. Based on this downtrend, we calculated the Fibonacci retracement levels. Analyzing these levels helps identify potential reversal points.
| Start Date | End Date | High (Price & Date) | Low (Price & Date) | Retracement Level | Level Price |
|---|---|---|---|---|---|
| 2026-02-17 | 2026-05-01 | $706.82 (2026-02-17) | $531.95 (2026-05-01) | 0.236 | $611.24 |
| 0.382 | $626.58 | ||||
| 0.5 | $638.89 | ||||
| 0.618 | $651.20 | ||||
| 0.786 | $668.39 |
The current stock price of ULTA at $537.48 falls within the 0.236 retracement zone, suggesting a potential resistance area. This technical indication points to a slowdown in the downtrend, where prices might find some support before deciding the next move.
Conclusion
Ulta Beauty's recent downtrend highlights the challenges in the broader retail and beauty sector. The stock's ability to recover from these retracement levels could signify renewed investor confidence or enduring market skepticism. Fundamental performance, upcoming quarterly results, and overall market sentiment should be closely monitored. This analysis warns of continued volatility, but the strong brand presence of Ulta Beauty offers a foundation for future resilience.
Smart Data Insight
Master the Perfect Entry & Exit for this Stock
Don't leave your profits to chance. Historically, this stock follows specific seasonal patterns that institutional traders use to maximize returns.
- ✅ Identify the "Golden Buying Window"
- ✅ Avoid high-risk correction cycles
- ✅ Backtested data from the last 20+ years