January 27, 2026 a 03:15 pm
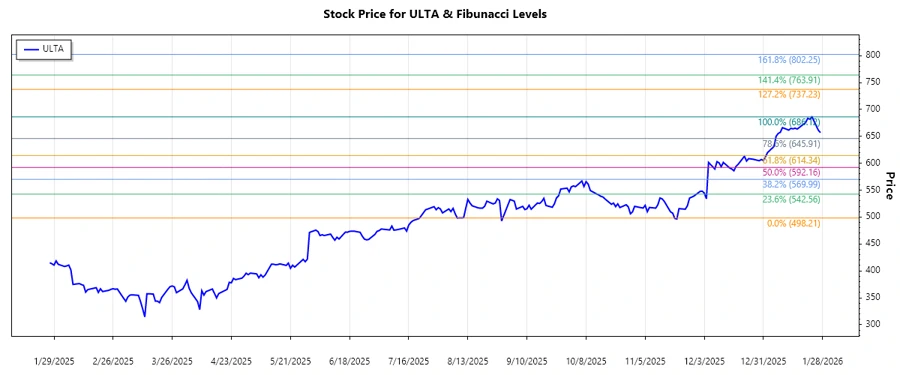
ULTA: Fibonacci Analysis - Ulta Beauty, Inc.
Ulta Beauty, Inc. has shown significant price fluctuations over the analyzed timeframe. Recent data indicates a dominant upward trend, suggesting strong investor confidence. With a robust business model and expansive product line, Ulta continues to capture market attention. The recent rally shows that the market participants anticipate further growth. However, the stock remains sensitive to broader market conditions and consumer behavior trends.
Fibonacci Analysis
| Details | Values |
|---|---|
| Trend Start Date | 2025-08-08 |
| Trend End Date | 2026-01-23 |
| High Point | 686.12 on 2026-01-23 |
| Low Point | 498.21 on 2025-08-08 |
| Fibonacci Level 0.236 | 549.9988 |
| Fibonacci Level 0.382 | 579.3742 |
| Fibonacci Level 0.5 | 592.165 |
| Fibonacci Level 0.618 | 604.9558 |
| Fibonacci Level 0.786 | 625.9132 |
| Current Price | 656.862 |
| Retracement Zone | None |
The current price of ULTA is notably above the key Fibonacci retracement levels, indicating strong bullish momentum. This suggests potential support around the higher retracement levels if the price retraces. However, traders should watch for potential resistance near the recent high should the momentum falter.
Conclusion
The analysis shows a clear upward trend for Ulta Beauty, Inc., supported by both commercial strategy and market positioning. Investors might see this trend as an opportunity to leverage potential further gains, as prices are presently beyond significant retracement levels, hinting at possible support areas. However, given the stock market volatility and shifts in consumer spending habits, investors should remain vigilant and consider setting strategic stop-loss orders to manage risk. While the upward momentum is positive, continuous monitoring is advised for any signs of trend reversal.