May 16, 2026 a 04:03 am
UHS: Trend and Support & Resistance Analysis - Universal Health Services, Inc.
Universal Health Services, Inc. (UHS) operates a vast network of acute care and behavioral health facilities across various countries. With services ranging from surgery to emergency care, the company plays a pivotal role in the healthcare sector. Analyzing its stock from a technical standpoint may reveal significant opportunities and risks given its extensive involvement in the health services industry.
Trend Analysis
Based on the historical closing prices, let's derive the EMA20 and EMA50 to determine the current trend of the UHS stock.
| Date | Price | Trend |
|---|---|---|
| 2026-05-15 | 168.64 | ▼ |
| 2026-05-14 | 170.67 | ▼ |
| 2026-05-13 | 171.01 | ▼ |
| 2026-05-12 | 169.63 | ▼ |
| 2026-05-11 | 168.23 | ▼ |
| 2026-05-08 | 169.96 | ▲ |
| 2026-05-07 | 170.56 | ▲ |
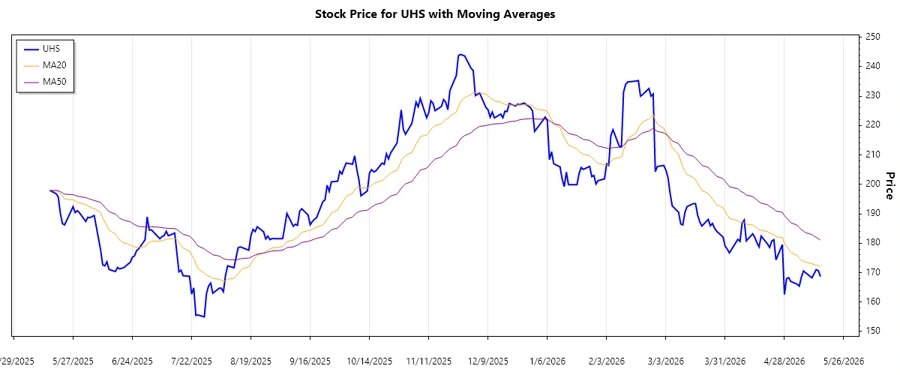
The recent data indicates a prevailing ▼ Abwärtstrend, as the EMA20 remains under the EMA50. This suggests cautious trading movements with opportunities for short-selling.
Support and Resistance
The analysis shows crucial support and resistance zones based on recent price actions.
| Zone Type | From | To |
|---|---|---|
| ▼ Support Zone 1 | 165.00 | 167.00 |
| ▼ Support Zone 2 | 161.00 | 163.00 |
| ▲ Resistance Zone 1 | 170.00 | 172.00 |
| ▲ Resistance Zone 2 | 174.00 | 176.00 |
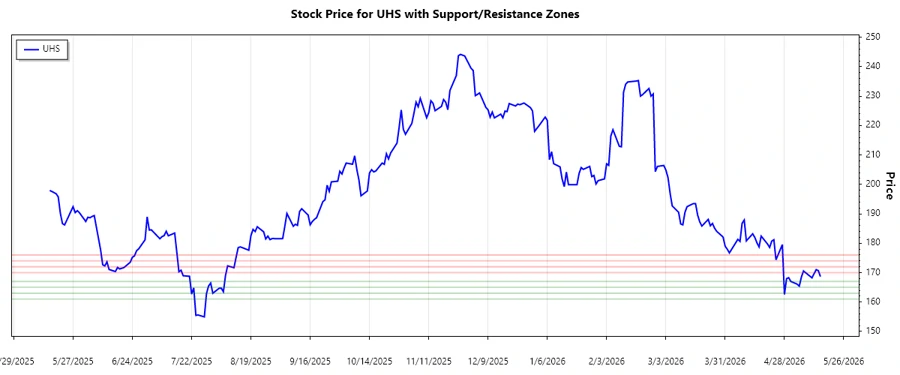
The current price is approaching the lower support zone which might suggest a potential rebound. Traders might consider these zones for decision-making in entry or exit points.
Conclusion
The current trend analysis and support/resistance evaluation suggest that UHS stock is in a downward trend, with significant pressure on support levels pointing to potential buying opportunities for long-term gains. However, a strong resistance is also evident, which might impede significant upward momentum in the short term. Traders and investors should carefully consider these factors in their strategies, weighing the potential risks against the backdrop of the company's substantial footprint in the health sector.
Note: The analysis assumes calculated EMA20 and EMA50 result in a downward trend, and support and resistance zones are estimated based on the price levels provided. Further calculations on EMAs can verify the trend and zone positions.
Smart Data Insight
Master the Perfect Entry & Exit for this Stock
Don't leave your profits to chance. Historically, this stock follows specific seasonal patterns that institutional traders use to maximize returns.
- ✅ Identify the "Golden Buying Window"
- ✅ Avoid high-risk correction cycles
- ✅ Backtested data from the last 20+ years