December 10, 2025 a 09:03 am

UHS: Trend and Support & Resistance Analysis - Universal Health Services, Inc.
Universal Health Services, Inc. (UHS) has shown significant fluctuations over the past months. Recently, the company has been facing market volatility, reflected in its stock price movements. The analysis reveals a fluctuating trend, with recent indicators suggesting a downward pressure on the stock price. Investors should consider both the technical aspects and the business fundamentals before making investment decisions.
Trend Analysis
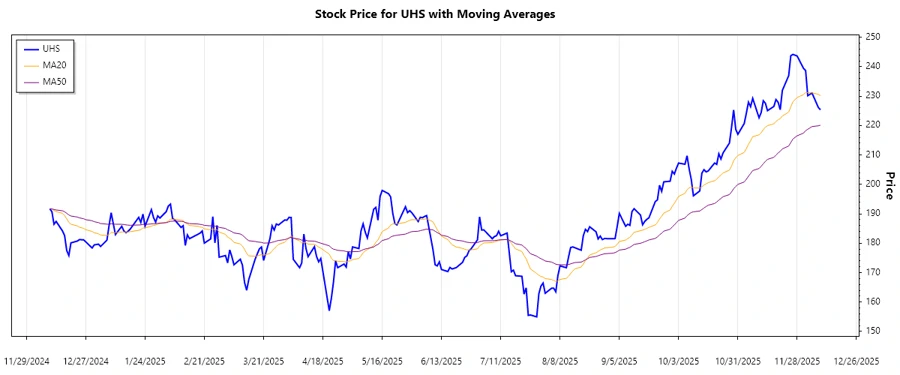
The UHS stock has displayed volatile behavior over the past months. By calculating the EMA20 and EMA50, we can assess the trend direction. When the EMA20 is greater than the EMA50, it indicates an uptrend, and conversely, when EMA20 is less than EMA50, it shows a downtrend. The following table illustrates the trend for the last seven days:
| Date | Close Price | Trend |
|---|---|---|
| 2025-12-09 | 225.35 | ▼ |
| 2025-12-08 | 226.13 | ▼ |
| 2025-12-05 | 231.08 | ▼ |
| 2025-12-04 | 230.59 | ▼ |
| 2025-12-03 | 230.15 | ▼ |
| 2025-12-02 | 238.68 | ▲ |
| 2025-12-01 | 239.43 | ▲ |
The short-term trend appears to be bearish, given the recent decline in closing prices, indicated by a majority of downward arrows. Technical indicators suggest caution for investors.
Support- and Resistance
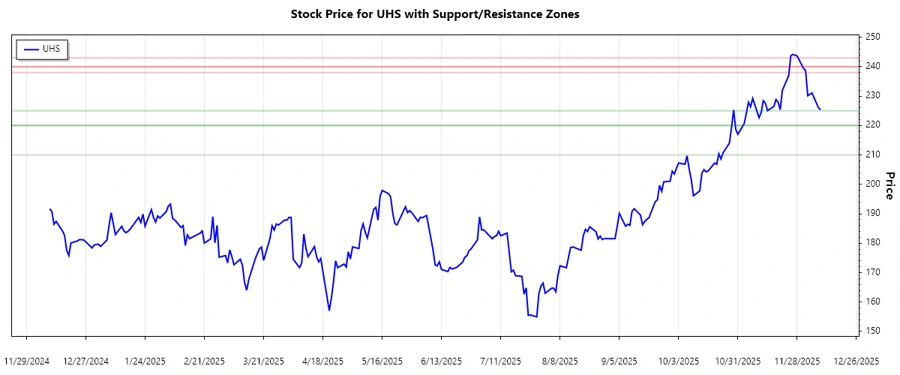
Analyzing support and resistance levels is crucial for understanding potential price movements. Based on the recent closing prices, the following support and resistance zones have been identified:
| Zone Type | From | To |
|---|---|---|
| Resistance 1 | 240.00 | 243.00 |
| Resistance 2 | 238.00 | 240.00 |
| Support 1 | 220.00 | 225.00 |
| Support 2 | 210.00 | 220.00 |
The current price is in close proximity to the second support zone, indicating a strong barrier against further downside movement. This zone could serve as a bouncing point, preventing further decline.
Conclusion
Overall, the Universal Health Services, Inc. stock exhibits a complex pattern of movement. With current indicators leaning towards a downtrend, potential support zones could prevent further declines. However, breaking below these levels could trigger additional downside risks. Investors should closely monitor any technical breakouts past the identified resistance zones for potential bullish opportunities. Technical analysis might need to be supplemented by broader economic factors and corporate fundamentals to reach an informed investment decision.