October 13, 2025 a 08:15 am
UHS: Trend and Support & Resistance Analysis - Universal Health Services, Inc.
Universal Health Services, Inc. (UHS) showcases a complex interplay of healthcare services, making it a key player in its industry. With a recent downward trajectory in stock performance, UHS presents both opportunities for growth as well as challenges amidst market volatility. The technical analysis of its stock indicates significant trends and potential resistance and support zones, guiding investors in decision-making processes.
Trend Analysis
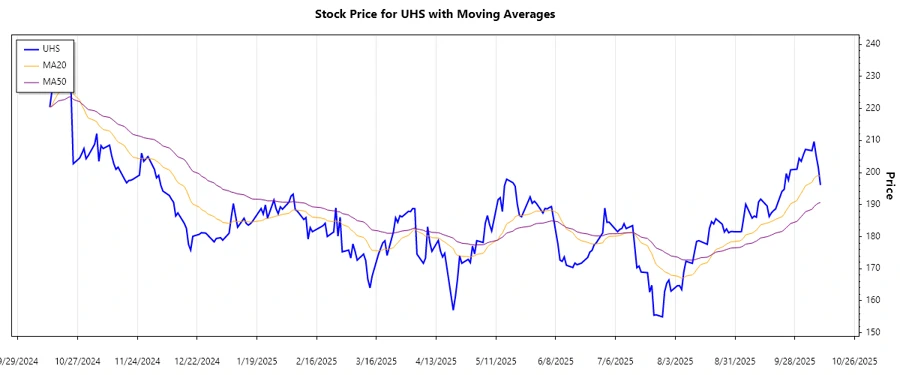
Analyzing the EMA20 and EMA50 reveals that the current trend for UHS is a downward one, as indicated by EMA20 being lower than EMA50. This suggests increased selling pressure over the observed period.
| Date | Closing Price | Trend |
|---|---|---|
| 10/10/2025 | 196.11 | ▼ |
| 10/09/2025 | 201.6 | ▼ |
| 10/08/2025 | 205.2 | ▼ |
| 10/07/2025 | 209.7 | ▲ |
| 10/06/2025 | 206.84 | ▼ |
| 10/03/2025 | 207.24 | ▲ |
| 10/02/2025 | 205.54 | ▼ |
The current downward trend may indicate a stronger selling bias, suggesting investors to proceed cautiously.
Support and Resistance
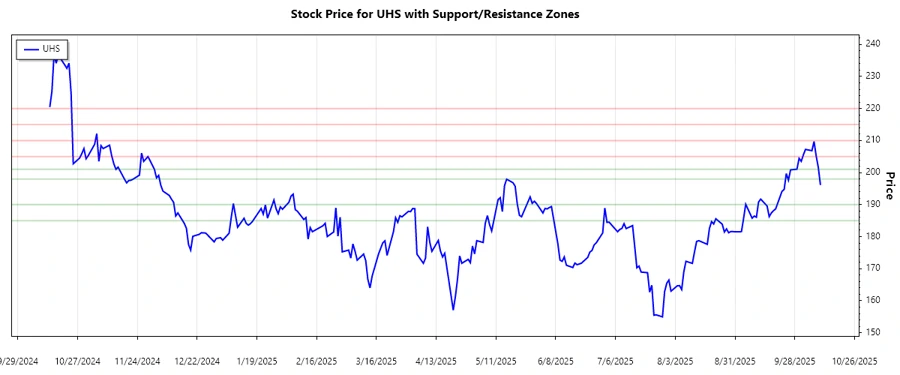
The analysis identifies key support and resistance zones, which are pivotal in determining price action points.
| Zone Type | From | To |
|---|---|---|
| Support | 185.00 | 190.00 |
| Support | 198.00 | 201.00 |
| Resistance | 205.00 | 210.00 |
| Resistance | 215.00 | 220.00 |
Currently, the price is hovering around the support zone of 198.00 - 201.00, suggesting potential buy opportunities if it holds.
Conclusion
In conclusion, Universal Health Services, Inc. is navigating a challenging market environment with an identified downward trend that poses caution for investors. The immediate support zone indicates a crucial point for potential reversals, whereas resistance levels highlight areas of previous price rejection. Market participants should carefully monitor these zones to make informed decisions, balancing the risks of further downturn against opportunities if support levels hold.
Smart Data Insight
Master the Perfect Entry & Exit for this Stock
Don't leave your profits to chance. Historically, this stock follows specific seasonal patterns that institutional traders use to maximize returns.
- ✅ Identify the "Golden Buying Window"
- ✅ Avoid high-risk correction cycles
- ✅ Backtested data from the last 20+ years