September 26, 2025 a 01:16 pm
UHS: Trend and Support & Resistance Analysis - Universal Health Services, Inc.
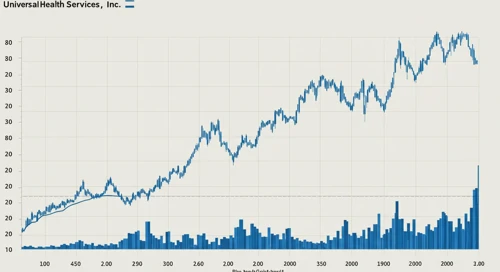
Universal Health Services, Inc. (UHS) stock has shown interesting movements over the past months. The company's stronghold in acute care and behavioral health services offers a balanced portfolio against market volatility. Recently, the stock has experienced fluctuations but remains a significant player in the healthcare sector. Analysts are keenly observing the trend and support/resistance levels to gauge future movements.
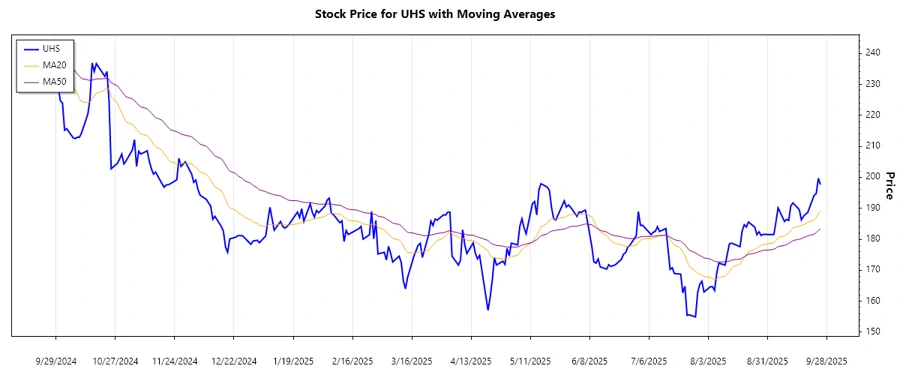
Trend Analysis
| Date | Close Price | Trend |
|---|---|---|
| 2025-09-25 | 197.62 | ▲ |
| 2025-09-24 | 199.7 | ▲ |
| 2025-09-23 | 194.72 | ▲ |
| 2025-09-22 | 194.16 | ▲ |
| 2025-09-19 | 188.64 | ▲ |
| 2025-09-18 | 188.11 | ▲ |
| 2025-09-17 | 187.39 | ▲ |
The current trend for UHS is a dominant upward movement, backed by the EMA20 crossing above the EMA50, indicative of a bullish momentum. This setup is often seen as a positive sign by traders and investors looking to ride the market wave.
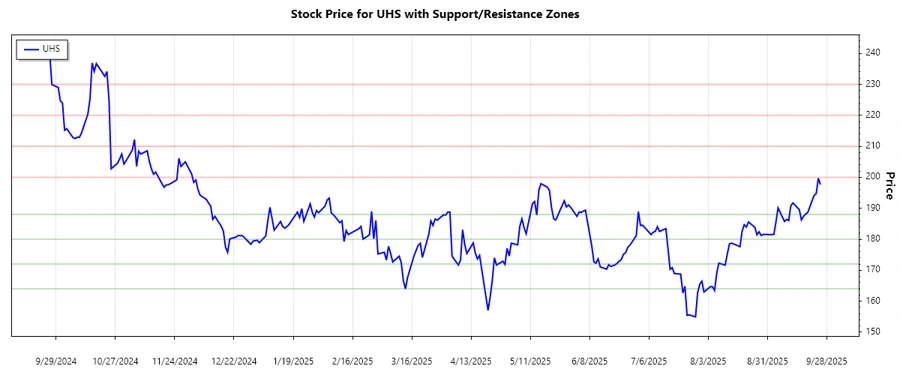
Support- and Resistance
| Zone Type | From | To |
|---|---|---|
| Support Zone 1 | 164.00 | 172.00 |
| Support Zone 2 | 180.00 | 188.00 |
| Resistance Zone 1 | 200.00 | 210.00 |
| Resistance Zone 2 | 220.00 | 230.00 |
The stock is currently near the upper limit of a support zone, indicating a strong floor for price action. The proximity to this zone suggests potential further upside, should market conditions remain favorable.
Conclusion
The UHS stock is presently experiencing a bullish trend as indicated by the upward EMA crossover. The identified support and resistance zones are critical for traders to watch for potential breakout or reversal signals. With the company's strong market position, UHS remains a robust contender in the healthcare sector. While the current market sentiment appears positive, investors should remain vigilant of external factors that may affect healthcare stocks in the near term.
Smart Data Insight
Master the Perfect Entry & Exit for this Stock
Don't leave your profits to chance. Historically, this stock follows specific seasonal patterns that institutional traders use to maximize returns.
- ✅ Identify the "Golden Buying Window"
- ✅ Avoid high-risk correction cycles
- ✅ Backtested data from the last 20+ years