
July 17, 2026 a 04:44 pm
UHS: Fibonacci Analysis - Universal Health Services, Inc.
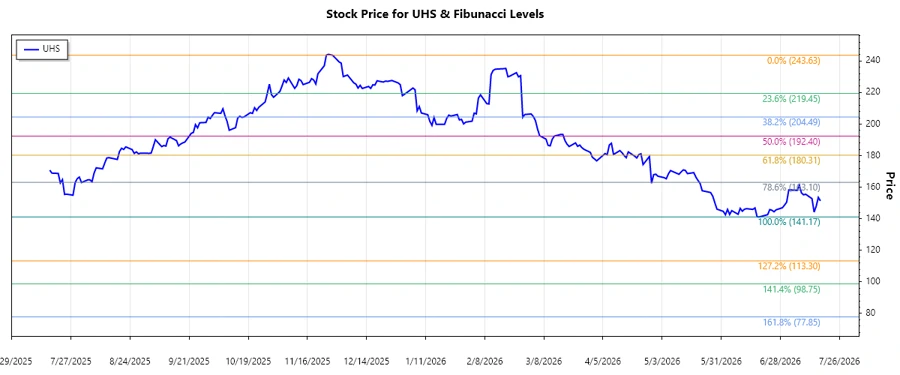
Universal Health Services, Inc. (UHS), has shown a recent trend of decreasing stock prices over the analyzed months, indicating a downtrend. This trend is crucial for investors as it might suggest a potential opportunity to buy at lower prices if the company fundamentals align with their strategy. Given the complexities in the healthcare sector, particularly post-pandemic, UHS continues to adapt by strategically managing its vast network of facilities.
Fibonacci Analysis
The following table provides a detailed breakdown of the Fibonacci retracement levels based on the identified downtrend in UHS stock prices:
| Type | Value | Date |
|---|---|---|
| Start Date | 2025-12-01 | |
| End Date | 2026-07-17 | |
| High | 243.63 | 2025-11-28 |
| Low | 141.17 | 2026-06-18 |
| Fibonacci Level | Price |
|---|---|
| 0.236 | 171.75 |
| 0.382 | 185.40 |
| 0.5 | 192.40 |
| 0.618 | 199.41 |
| 0.786 | 212.06 |
The current price of UHS is around 151.34 and sits outside the main Fibonacci retracement levels, indicating it may continue to move within the lower range of its recent trend. This suggests possible technical support around these levels.
Conclusion
The UHS stock is currently in a potential consolidation phase after a significant downtrend. As it hovers near its recent low, this may suggest a possible support level. However, the healthcare sector is subjected to various risks, including regulatory changes and operational costs. The downward pressure could either present buying opportunities at current low levels or signify further declines if negative catalysts persist. For analysts, monitoring upcoming earnings reports and market conditions will be crucial in predicting future stock performance.
Smart Data Insight
Master the Perfect Entry & Exit for this Stock
Don't leave your profits to chance. Historically, this stock follows specific seasonal patterns that institutional traders use to maximize returns.
- ✅ Identify the "Golden Buying Window"
- ✅ Avoid high-risk correction cycles
- ✅ Backtested data from the last 20+ years