
July 27, 2026 a 11:31 am

UHS: Dividend Analysis - Universal Health Services, Inc.
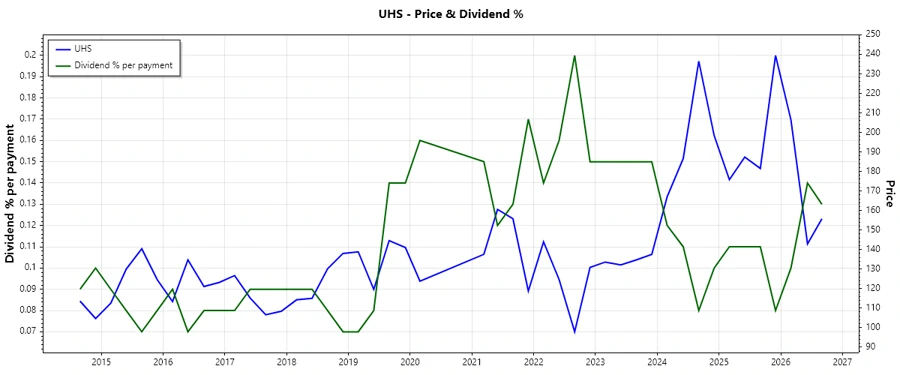
Universal Health Services, Inc. (UHS) offers a consistent yet modest dividend yield, which reflects its strategic financial management. With over two decades of dividend payment history, UHS showcases stability and commitment to returning value to shareholders. However, the recent growth in dividends remains relatively low, indicating limited expansion in shareholder returns.
📊 Overview
Universal Health Services, Inc., operating in the healthcare sector, provides investors with modest yet steady dividends. The company's performance across dividend-related metrics signifies a calculated and cautious approach to financial growth and distribution.
| Metric | Value |
|---|---|
| Sector | Healthcare |
| Dividend yield | 0.51% |
| Current dividend per share | 0.81 USD |
| Dividend history | 23 years |
| Last cut or suspension | None |
📈 Dividend History
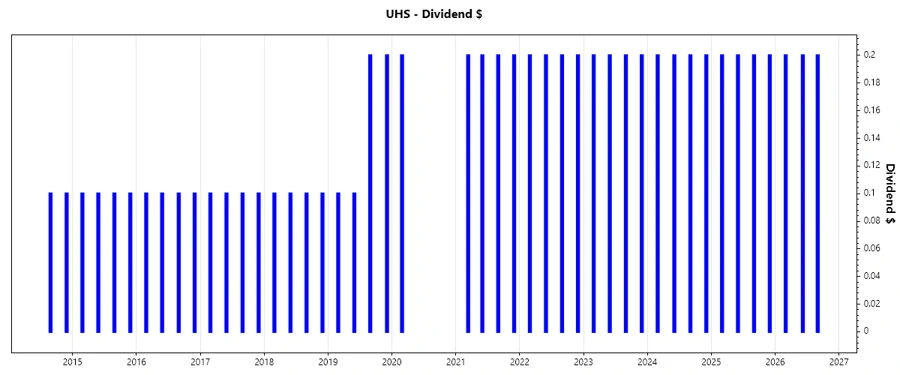
The dividend history of UHS reflects a long-standing commitment to rewarding its shareholders, though recent years indicate a certain plateau in dividend growth. This historical perspective is critical for investors looking at long-term stability and potential income.
| Year | Dividend per Share (USD) |
|---|---|
| 2026 | 0.6 |
| 2025 | 0.8 |
| 2024 | 0.8 |
| 2023 | 0.8 |
| 2022 | 0.8 |
🔄 Dividend Growth
Evaluating dividend growth offers insight into the company's capacity to enhance shareholder value over time. UHS demonstrates negligible dividend growth in recent years, suggesting a necessity for strategic adjustments to boost investor returns.
| Time | Growth |
|---|---|
| 3 years | 0% |
| 5 years | 0.32% |
The average dividend growth is 0.32% over 5 years. This shows moderate but steady dividend growth.
💰 Payout Ratio
The payout ratio provides a measure of a company's ability to sustain dividends relative to earnings and cash flow. UHS shows considerable conservatism in its earnings-based payout, suggesting sufficient room for future growth without jeopardizing financial stability.
| Key figure | Ratio |
|---|---|
| EPS-based | 3.24% |
| Free cash flow-based | 5.65% |
The EPS payout ratio of 3.24% and FCF payout ratio of 5.65% indicate a conservative dividend distribution policy, allowing room for future financial flexibility.
💼 Cashflow & Capital Efficiency
Analyzing cash flow metrics is essential to assess UHS's operational efficiency and overall financial health. The trends in free cash flow and capital expenditures reflect the company's capability to manage its resources effectively.
| Year | 2025 | 2024 | 2023 |
|---|---|---|---|
| Free Cash Flow Yield | 6.13% | 9.41% | 4.97% |
| Earnings Yield | 10.74% | 9.56% | 6.79% |
| CAPEX to Operating Cash Flow | 54.45% | 45.66% | 58.61% |
| Stock-based Compensation to Revenue | 0.55% | 0.63% | 0.61% |
| Free Cash Flow / Operating Cash Flow Ratio | 45.55% | 54.34% | 41.39% |
The stable capital efficiency and cash flow measures indicate robust management practices, supporting the company's ongoing operational demands and strategic initiatives.
⚠️ Balance Sheet & Leverage Analysis
A balanced evaluation of leverage ratios aids in understanding UHS's debt structure and financial stability. A relatively controlled debt-to-equity ratio suggests prudent financial management and adequate capacity to service debts.
| Year | 2025 | 2024 | 2023 |
|---|---|---|---|
| Debt-to-Equity | 75.69% | 74.34% | 87.28% |
| Debt-to-Assets | 34.51% | 34.25% | 38.42% |
| Debt-to-Capital | 43.08% | 42.64% | 46.60% |
| Net Debt to EBITDA | 1.96 | 2.13 | 3.06 |
| Current Ratio | 1.05 | 1.27 | 1.40 |
| Quick Ratio | 0.98 | 1.17 | 1.29 |
| Financial Leverage | 2.19 | 2.17 | 2.27 |
UHS's balance sheet displays resilience, characterized by adequate liquidity and a moderate leverage position, which provides a safeguard against financial uncertainties.
📈 Fundamental Strength & Profitability
Assessing profitability and fundamental strength reveals UHS's ability to sustain its earnings and efficient use of assets. The robust net and gross margins reflect strong operational performance.
| Year | 2025 | 2024 | 2023 |
|---|---|---|---|
| Return on Equity | 20.46% | 17.13% | 11.67% |
| Return on Assets | 9.33% | 7.89% | 5.14% |
| Margins: Net | 8.57% | 7.22% | 5.03% |
| Margins: EBIT | 12.23% | 10.62% | 8.03% |
| Margins: EBITDA | 15.80% | 14.31% | 12.01% |
| Margins: Gross | 90.45% | 89.97% | 89.27% |
| Research & Development to Revenue | 0% | 0% | 0% |
The high return metrics and profit margins reflect UHS's strategic advantage and ability to deliver substantial shareholder value through consistent operational excellence.
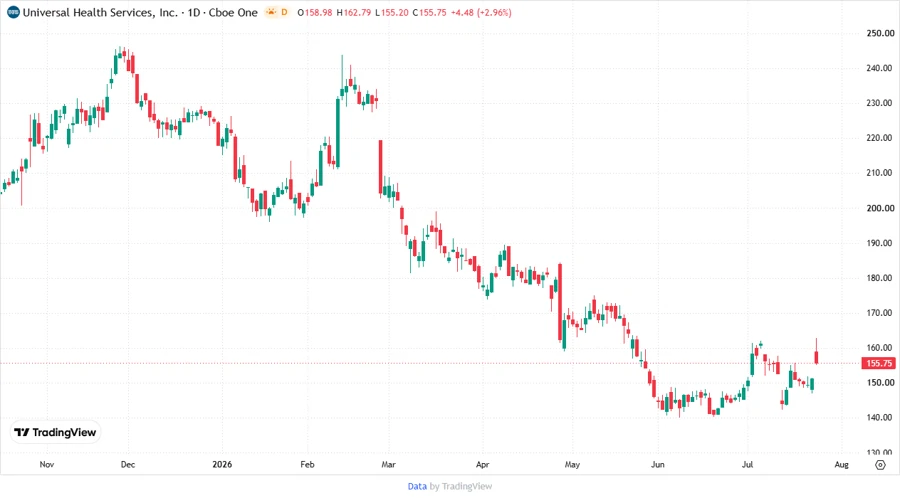
📉 Price Development
🗣️ Dividend Scoring System
| Criteria | Score | Indicator |
|---|---|---|
| Dividend yield | 2 | |
| Dividend Stability | 4 | |
| Dividend growth | 1 | |
| Payout ratio | 5 | |
| Financial stability | 4 | |
| Dividend continuity | 5 | |
| Cashflow Coverage | 3 | |
| Balance Sheet Quality | 4 |
Total Score: 28/40
✅ Rating
Universal Health Services, Inc. exhibits a remarkable blend of stability and prudent financial management with established dividend history and promising financial metrics. Despite modest dividend growth, its overall financial health supports a solid investment case for shareholders seeking consistent income. I recommend a cautious buy, factoring in the potential for future dividend enhancement and strengthened market position.
Smart Data Insight
Master the Perfect Entry & Exit for this Stock
Don't leave your profits to chance. Historically, this stock follows specific seasonal patterns that institutional traders use to maximize returns.
- ✅ Identify the "Golden Buying Window"
- ✅ Avoid high-risk correction cycles
- ✅ Backtested data from the last 20+ years