February 13, 2026 a 11:31 am


UHS: Dividend Analysis - Universal Health Services, Inc.
Universal Health Services, Inc. (UHS) represents a compelling case within the healthcare sector. Despite a relatively modest dividend yield, the company's stable and gradually growing dividend history, coupled with strong financial fundamentals, provides a platform for potential long-term investment gains. The dividend growth over 5 years and a prudent payout ratio reflect management's discipline and a focus on sustainable shareholder returns.
📊 Overview
The overview below showcases essential data points focusing on the company's dividend specifics and market classification. Universal Health Services operates within the healthcare sector, demonstrating a stable track record of dividends over 24 years, with the last cut or suspension in 2020, illustrating resilience in crisis management.
| Sector | Dividend Yield | Current Dividend per Share | Dividend History | Last Cut or Suspension |
|---|---|---|---|---|
| Healthcare | 0.33 % | 0.80 USD | 24 years | 2020 |
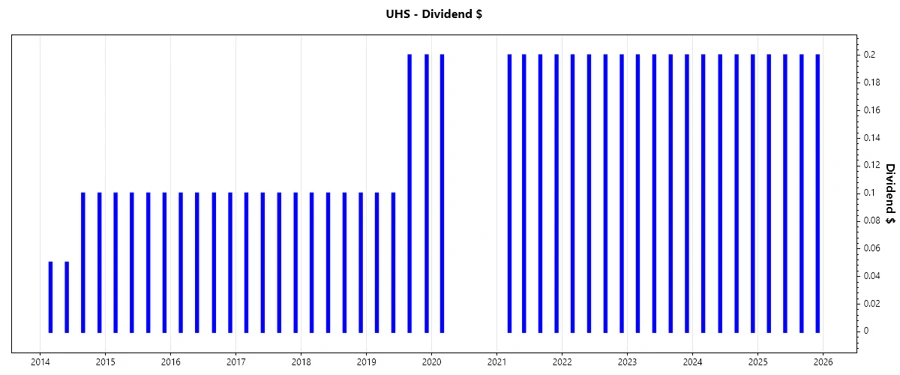
🗣️ Dividend History
The consistent payment record evidences UHS's commitment to returning capital to its shareholders. Despite the 2020 reduction, the dividends have remained steady at 0.80 USD per share since then. This consistency is vital for investors seeking reliable income streams.
| Year | Dividend per Share (USD) |
|---|---|
| 2025 | 0.80 |
| 2024 | 0.80 |
| 2023 | 0.80 |
| 2022 | 0.80 |
| 2021 | 0.80 |
📈 Dividend Growth
The ability of a company to grow its dividend is a key indicator of financial health and business stability. UHS's dividend growth over 5 years aligns with a modest but stable increase, enhancing investor confidence in long-term sustainability.
| Time | Growth |
|---|---|
| 3 years | 0.00 % |
| 5 years | 0.32 % |
The average dividend growth is 0.32 % over 5 years. This shows moderate but steady dividend growth.
⚖️ Payout Ratio
Payout ratios indicate the proportion of earnings and free cash flow paid out as dividends. UHS's conservative EPS and FCF payout ratios suggest strong retention for reinvestments or debt management.
| Key Figure | Ratio |
|---|---|
| EPS-based | 3.75 % |
| Free cash flow-based | 5.44 % |
Both 3.75 % (EPS) and 5.44 % (FCF) indicate a conservative payout strategy, focusing on business growth and financial stability.
💵 Cashflow & Capital Efficiency
Evaluating cash flow and capital efficiency reveals the operational robustness of UHS. With a healthy free cash flow yield and prudent capital allocation, the company stands resilient against economic adversities.
| Ratio | 2024 | 2023 | 2022 |
|---|---|---|---|
| Free Cash Flow Yield | 9.41 % | 4.97 % | 2.54 % |
| Earnings Yield | 9.56 % | 6.79 % | 6.56 % |
| CAPEX to Operating Cash Flow | 45.66 % | 58.61 % | 73.69 % |
| Stock-based Compensation to Revenue | 0.63 % | 0.61 % | 0.64 % |
| Free Cash Flow / Operating Cash Flow Ratio | 54.34 % | 41.39 % | 26.31 % |
UHS's judicious capital allocation and strong cash flow practices promote stable capital efficiency, which is pivotal for sustained growth.
🏦 Balance Sheet & Leverage Analysis
The financial structure of UHS reflects a balanced leverage approach, maintaining a manageable debt level and solid liquidity metrics. Such stability is crucial in sustaining long-term operations.
| Metric | 2024 | 2023 | 2022 |
|---|---|---|---|
| Debt-to-Equity | 0.74 | 0.87 | 0.89 |
| Debt-to-Assets | 0.34 | 0.38 | 0.39 |
| Debt-to-Capital | 0.43 | 0.47 | 0.47 |
| Net Debt to EBITDA | 2.13 | 3.07 | 3.28 |
| Current Ratio | 1.27 | 1.40 | 1.33 |
| Quick Ratio | 1.17 | 1.29 | 1.21 |
| Financial Leverage | 2.17 | 2.27 | 2.28 |
UHS's leverage and liquidity ratios suggest a stable balance sheet with adequate coverage to meet its obligations.
🧮 Fundamental Strength & Profitability
Analyzing profitability margins gives insight into operational efficiency. UHS's margins and returns indicate a healthy, profitable enterprise.
| Metric | 2024 | 2023 | 2022 |
|---|---|---|---|
| Return on Equity | 17.13 % | 11.67 % | 11.41 % |
| Return on Assets | 7.89 % | 5.14 % | 5.01 % |
| Net Margin | 7.22 % | 5.03 % | 5.04 % |
| EBIT Margin | 10.62 % | 8.00 % | 7.41 % |
| EBITDA Margin | 14.31 % | 11.98 % | 11.75 % |
| Gross Margin | 89.97 % | 89.27 % | 88.99 % |
| Research & Development to Revenue | 0 % | 0 % | 0 % |
With consistent returns and margins, UHS displays solid profitability, emphasizing operational efficiency and cost management.
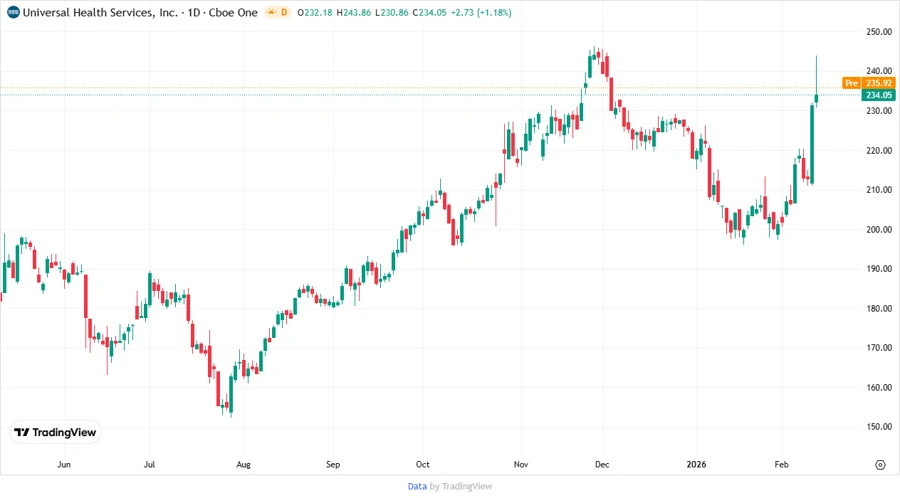
📉 Price Development
📝 Dividend Scoring System
| Criteria | Score | Scale |
|---|---|---|
| Dividend yield | 2/5 | |
| Dividend Stability | 4/5 | |
| Dividend growth | 3/5 | |
| Payout ratio | 5/5 | |
| Financial stability | 4/5 | |
| Dividend continuity | 4/5 | |
| Cashflow Coverage | 4/5 | |
| Balance Sheet Quality | 4/5 |
Overall Score: 30/40
✅ Rating
Universal Health Services, Inc. presents itself as a valuable investment in terms of reliable dividend returns. With solid financial health, disciplined payout ratios, and steady dividend growth, UHS offers a promising proposition for income-focused investors. However, potential investors should remain cognizant of the relatively modest yield and monitor the company's ongoing performance.