
July 23, 2026 a 04:03 am

UDR: Trend and Support & Resistance Analysis - UDR, Inc.
UDR, Inc., a leading player in the multifamily real estate investment sector, has consistently demonstrated resilience and growth through strategic management of its properties. Within recent months, the stock has shown promising trend patterns, supported by calculated investments in prime markets. Nevertheless, fluctuations indicative of market sentiment can also be observed, requiring careful monitoring for future positions.
Trend Analysis
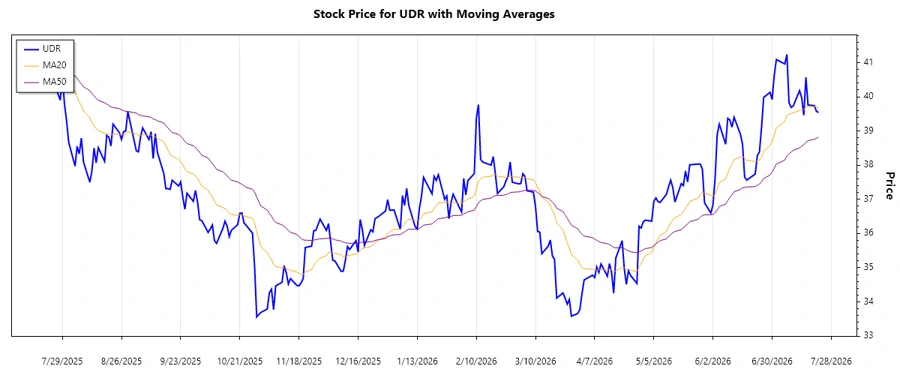
The trend in the current dataset can be assessed by analyzing short and medium-term moving averages, specifically the EMA20 and EMA50. The calculated EMAs indicate that:
| Date | Closing Price | Trend |
|---|---|---|
| 2026-07-22 | 39.54 | ▲ Uptrend |
| 2026-07-21 | 39.57 | ▲ Uptrend |
| 2026-07-20 | 39.74 | ▲ Uptrend |
| 2026-07-17 | 39.76 | ▲ Uptrend |
| 2026-07-16 | 40.57 | ▲ Uptrend |
| 2026-07-15 | 39.46 | ▲ Uptrend |
| 2026-07-14 | 39.97 | ▲ Uptrend |
Technically, the dominance of the EMA20 over the EMA50 signifies an ongoing uptrend, suggesting continued positive momentum in the near term.
Support and Resistance
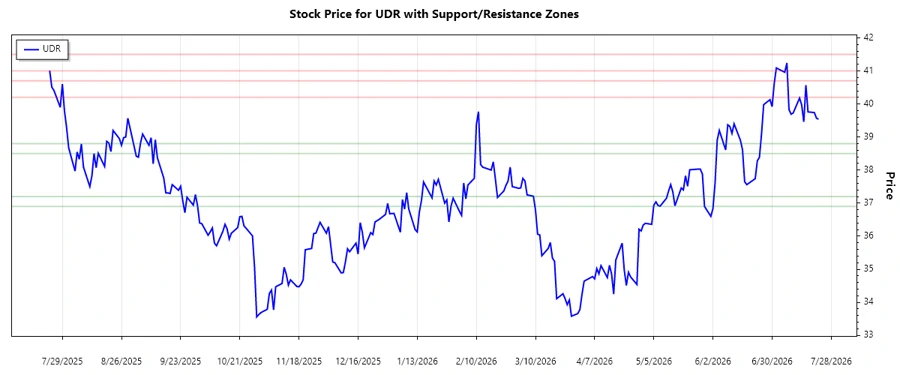
Within the current timeframe, key support and resistance zones can be identified as follows:
| Zone Type | From | To |
|---|---|---|
| Support | 38.50 | 38.80 |
| Support | 36.90 | 37.20 |
| Resistance | 40.20 | 40.70 |
| Resistance | 41.00 | 41.50 |
Currently, the stock price is positioned within a resistance zone, indicating potential upward pressure if the stock manages to break through resistance levels. This signals an essential inflection point for traders.
Conclusion
UDR, Inc. shows a promising uptrend reinforced by its EMA analysis, potentially leading to newfound investor confidence. Should the stock successfully surpass its current resistance zones, it could signal further bullish opportunities. Yet, prevailing market conditions necessitate vigilance due to inherent volatility, primarily if critical supports are breached. This analysis underscores the importance of monitoring real-time data to assess ongoing risks and opportunities effectively.
Smart Data Insight
Master the Perfect Entry & Exit for this Stock
Don't leave your profits to chance. Historically, this stock follows specific seasonal patterns that institutional traders use to maximize returns.
- ✅ Identify the "Golden Buying Window"
- ✅ Avoid high-risk correction cycles
- ✅ Backtested data from the last 20+ years