
May 27, 2026 a 03:43 pm
UDR: Fundamental Ratio Analysis - UDR, Inc.
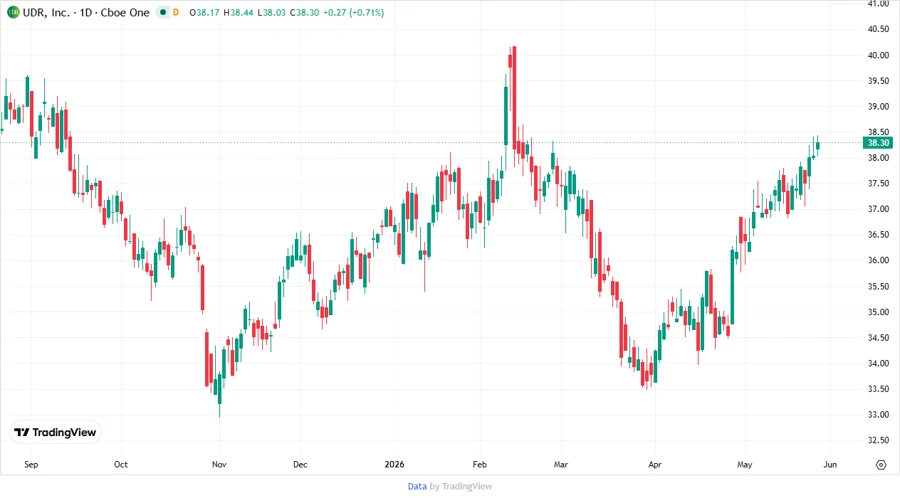
UDR, Inc., a leader in the residential REIT sector, continues to demonstrate stability in returns through strategic real estate management. While current market conditions pose challenges, UDR's strong historical performance suggests resilience. Investors should note the company's long-term value creation track record when considering this stock.
Fundamental Rating
The current fundamental metrics for UDR highlight a mixed outlook with strengths in return metrics but caution regarding valuation multiples and debt levels.
| Metric | Score | Visualization |
|---|---|---|
| Discounted Cash Flow | 3 | |
| Return on Equity | 5 | |
| Return on Assets | 5 | |
| Debt to Equity | 1 | |
| Price to Earnings | 2 | |
| Price to Book | 1 |
Historical Rating
An examination of the historical ratings provides insights into the company's consistency and market adaptability.
| Date | Overall Score | DCF | ROE | ROA | D/E | P/E | P/B |
|---|---|---|---|---|---|---|---|
| 2026-05-26 | 3 | 3 | 5 | 5 | 1 | 2 | 1 |
| Previous | 0 | 3 | 5 | 5 | 1 | 2 | 1 |
Analyst Price Targets
Analyst projections indicate moderate optimism with a price range suggesting potential upside, yet reflective of market uncertainties.
| High | Low | Median | Consensus |
|---|---|---|---|
| $42 | $35 | $40 | $39.5 |
Analyst Sentiment
Current sentiment retains a favorable bias with a majority of analysts endorsing 'Buy' ratings, reflecting confidence in UDR's strategic outlook.
| Recommendation | Count | Distribution |
|---|---|---|
| Strong Buy | 0 | |
| Buy | 18 | |
| Hold | 17 | |
| Sell | 3 | |
| Strong Sell | 0 |
Conclusion
Investors evaluating UDR, Inc. should balance the company's robust return metrics and strong market outlook against the potential risks highlighted by unfavorable valuation ratios. While analyst sentiment is largely positive, prospective uncertainties in the real estate market warrant a cautious approach. The company's stable historical performance might offer some assurance, making it a potentially solid addition to a diversified portfolio, albeit with mindful risk assessment.
Smart Data Insight
Master the Perfect Entry & Exit for this Stock
Don't leave your profits to chance. Historically, this stock follows specific seasonal patterns that institutional traders use to maximize returns.
- ✅ Identify the "Golden Buying Window"
- ✅ Avoid high-risk correction cycles
- ✅ Backtested data from the last 20+ years