November 03, 2025 a 04:45 pm
UDR: Fibonacci Analysis - UDR, Inc.
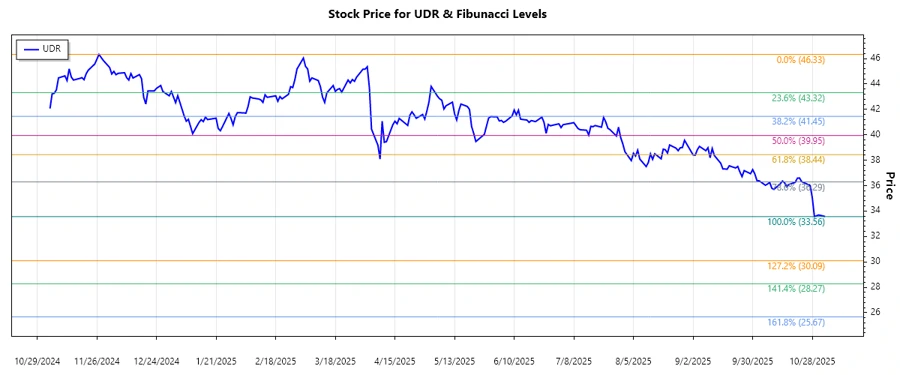
UDR, Inc., a prominent player in the real estate investment trust sector, focuses on multifamily residential properties. Despite recent fluctuations, the company’s strategic positioning in targeted U.S. markets underpins its long-term growth potential. As we delve into a Fibonacci analysis of UDR's recent price movements, it is clear that the stock has experienced significant shifts, paving the path for potential trading opportunities. Investors should keep an eye on Fibonacci levels for potential entry or exit points.
Fibonacci Analysis
| Attribute | Details |
|---|---|
| Start Date | 2024-11-04 |
| End Date | 2025-11-03 |
| High Price | $46.33 on 2024-11-27 |
| Low Price | $33.56 on 2025-10-29 |
| Fibonacci Levels |
|
| Current Price | $33.575 |
| Retracement Zone | None |
| Technical Interpretation | The stock is trading below the 0.236 level, indicating a strong downtrend. This could suggest significant resistance at higher Fibonacci levels unless bullish momentum builds. |
Conclusion
UDR, Inc.'s stock has been in a consistent downtrend, as highlighted by the recent breach of significant support levels. The stock's inability to maintain above key Fibonacci retracement levels indicates persistent bearish pressure. However, this scenario might offer a potential buying opportunity for investors seeking entry at lower valuations, with the anticipation of a market correction. Continual monitoring of Fibonacci levels can provide early signals for potential trend reversals or continuation. Despite these risks, UDR remains a strong entity in the multifamily REIT space, which could support recovery in the long term.
Smart Data Insight
Master the Perfect Entry & Exit for this Stock
Don't leave your profits to chance. Historically, this stock follows specific seasonal patterns that institutional traders use to maximize returns.
- ✅ Identify the "Golden Buying Window"
- ✅ Avoid high-risk correction cycles
- ✅ Backtested data from the last 20+ years